
MATLAB: An Introduction with Applications
6th Edition
ISBN: 9781119256830
Author: Amos Gilat
Publisher: John Wiley & Sons Inc
expand_more
expand_more
format_list_bulleted
Related questions
Question
Help please week 10
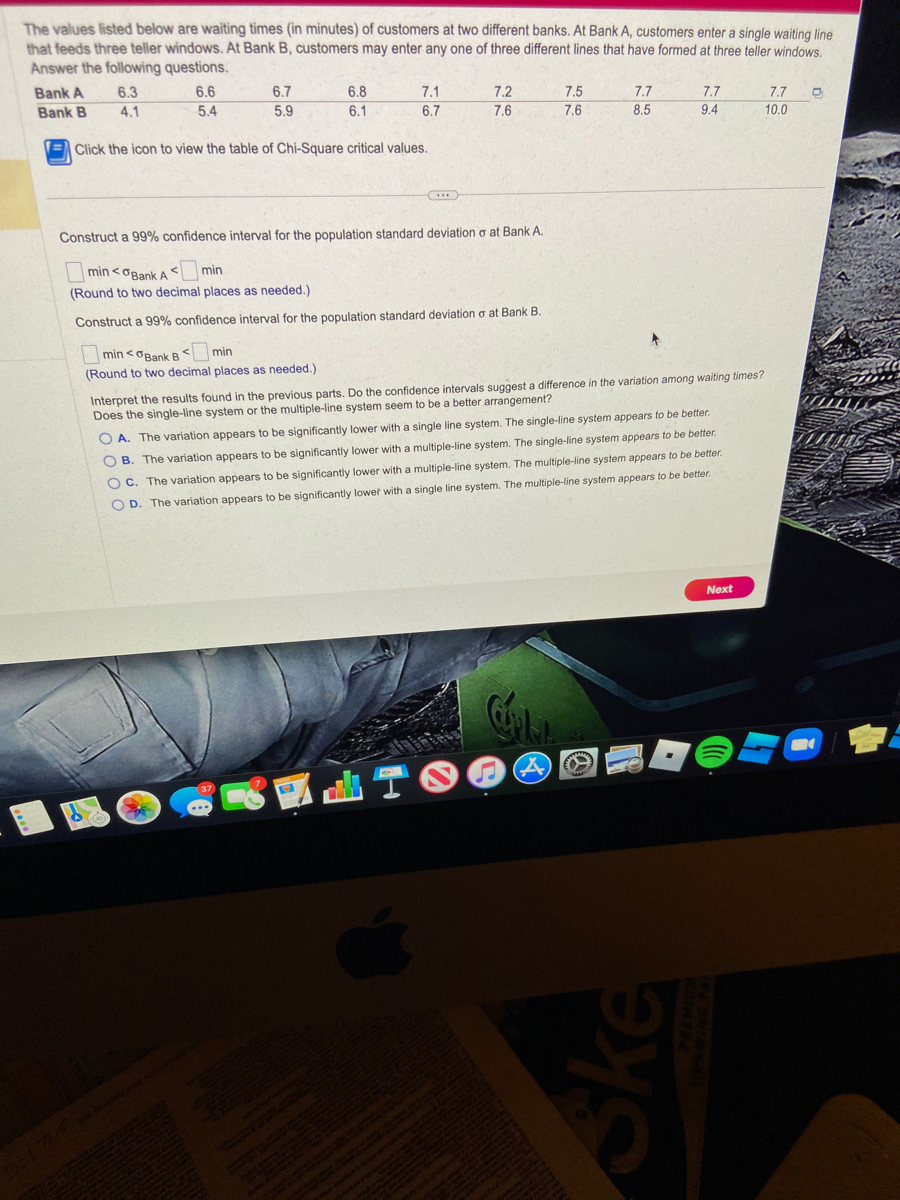

Transcribed Image Text:The values listed below are waiting times (in minutes) of customers at two different banks. At Bank A, customers enter a single waiting line
that feeds three teller windows. At Bank B, customers may enter any one of three different lines that have formed at three teller windows.
Answer the following questions.
Bank A
Bank B
6.3
4.1
6.6
5.4
16
6.7
5.9
6.8
6.1
Click the icon to view the table of Chi-Square critical values.
7.1
6.7
min <0Bank B min
<
(Round to two decimal places as needed.)
***
Construct a 99% confidence interval for the population standard deviation o at Bank A.
min<Bank Amin
(Round to two decimal places as needed.)
Construct a 99% confidence interval for the population standard deviation o at Bank B.
7.2
7.6
7.5
7.6
CÚPLA
A
w
7.7
8.5
www.
4
Interpret the results found in the previous parts. Do the confidence intervals suggest a difference in the variation among waiting times?
Does the single-line system or the multiple-line system seem to be a better arrangement?
OA. The variation appears to be significantly lower with a single line system. The single-line system appears to be better.
B. The variation appears to be significantly lower with a multiple-line system. The single-line system appears to be better.
OC. The variation appears to be significantly lower with a multiple-line system. The multiple-line system appears to be better.
OD. The variation appears to be significantly lower with a single line system. The multiple-line system appears to be better.
7.7
Ske
9.4
Next
7.7
10.0
D
B

Transcribed Image Text:Area to the right of the critical value
D
Degrees of
Freedom
1
APR
13
2
3
4
5
6
7
8
9
10
11
12
Chi-Square (X2) Distribution
0.995
-
0.010
0.072
0.207
0.412
0.676
0.989
1.344
1.735
2.156
2.603
3.074
6
(O
0.99
0.020
0.115
0.297
0.554
0.872
1.239
1.646
2.088
2.558
3.053
3.571
0.975
0.001
0.051
0.216
0.484
0.831
1.237
1.690
2.180
2.700
3.247
3.816
4.404
Print
Area to the Right of the Critical Value
0.95
0.004
103
0.352
0.711
1.145
1.635
2.167
2.733
3.325
3.940
4.575
5.226
0.90
0.016
0.211
0.584
1.064
1.610
2.204
2.833
3.490
4.168
4.865
5.578
6.304
Done
LTOO
0.10
2.706
4.605
6.251
7.779
9.236
10.645
12.017
13.362
14.684
15.987
17.275
18.549
A
19.675
0.05
5.991
7.815
9.488
11.071
12.592
14.067
15.507
16.919
18.307
21.026
ATTERY
3.841
0.025
5.024
7.378
9.348
11.143
12.833
14.449
16.013
Ske
17.535
19.023
20.483
21.920
23.337
Text
be
to
- X
ong
be
Expert Solution
This question has been solved!
Explore an expertly crafted, step-by-step solution for a thorough understanding of key concepts.
Step 1: Obtain the 99% confidence interval for the population standard deviation at Bank A.
VIEW Step 2: Obtain the critical values
VIEW Step 3: calculate the confidence interval
VIEW Step 4: Obtain the 99% confidence interval for the population standard deviation at Bank B
VIEW Step 5: calculate the confidence interval for Bank B
VIEW Step 6: Determine whether the single line system or multiple line system seem to be a better arrangement.
VIEW Solution
VIEW 
Step by stepSolved in 7 steps with 6 images

Knowledge Booster

Similar questions
Recommended textbooks for you
- MATLAB: An Introduction with ApplicationsStatisticsISBN:9781119256830Author:Amos GilatPublisher:John Wiley & Sons Inc
 Probability and Statistics for Engineering and th...StatisticsISBN:9781305251809Author:Jay L. DevorePublisher:Cengage Learning
 Statistics for The Behavioral Sciences (MindTap C...StatisticsISBN:9781305504912Author:Frederick J Gravetter, Larry B. WallnauPublisher:Cengage Learning
  Elementary Statistics: Picturing the World (7th E...StatisticsISBN:9780134683416Author:Ron Larson, Betsy FarberPublisher:PEARSON
 The Basic Practice of StatisticsStatisticsISBN:9781319042578Author:David S. Moore, William I. Notz, Michael A. FlignerPublisher:W. H. Freeman
 Introduction to the Practice of StatisticsStatisticsISBN:9781319013387Author:David S. Moore, George P. McCabe, Bruce A. CraigPublisher:W. H. Freeman
MATLAB: An Introduction with Applications
Statistics
ISBN:9781119256830
Author:Amos Gilat
Publisher:John Wiley & Sons Inc
Probability and Statistics for Engineering and th...
Statistics
ISBN:9781305251809
Author:Jay L. Devore
Publisher:Cengage Learning
Statistics for The Behavioral Sciences (MindTap C...
Statistics
ISBN:9781305504912
Author:Frederick J Gravetter, Larry B. Wallnau
Publisher:Cengage Learning
Elementary Statistics: Picturing the World (7th E...
Statistics
ISBN:9780134683416
Author:Ron Larson, Betsy Farber
Publisher:PEARSON
The Basic Practice of Statistics
Statistics
ISBN:9781319042578
Author:David S. Moore, William I. Notz, Michael A. Fligner
Publisher:W. H. Freeman
Introduction to the Practice of Statistics
Statistics
ISBN:9781319013387
Author:David S. Moore, George P. McCabe, Bruce A. Craig
Publisher:W. H. Freeman