
MATLAB: An Introduction with Applications
6th Edition
ISBN: 9781119256830
Author: Amos Gilat
Publisher: John Wiley & Sons Inc
expand_more
expand_more
format_list_bulleted
Related questions
Question

Transcribed Image Text:06:23
A myopenmath.com
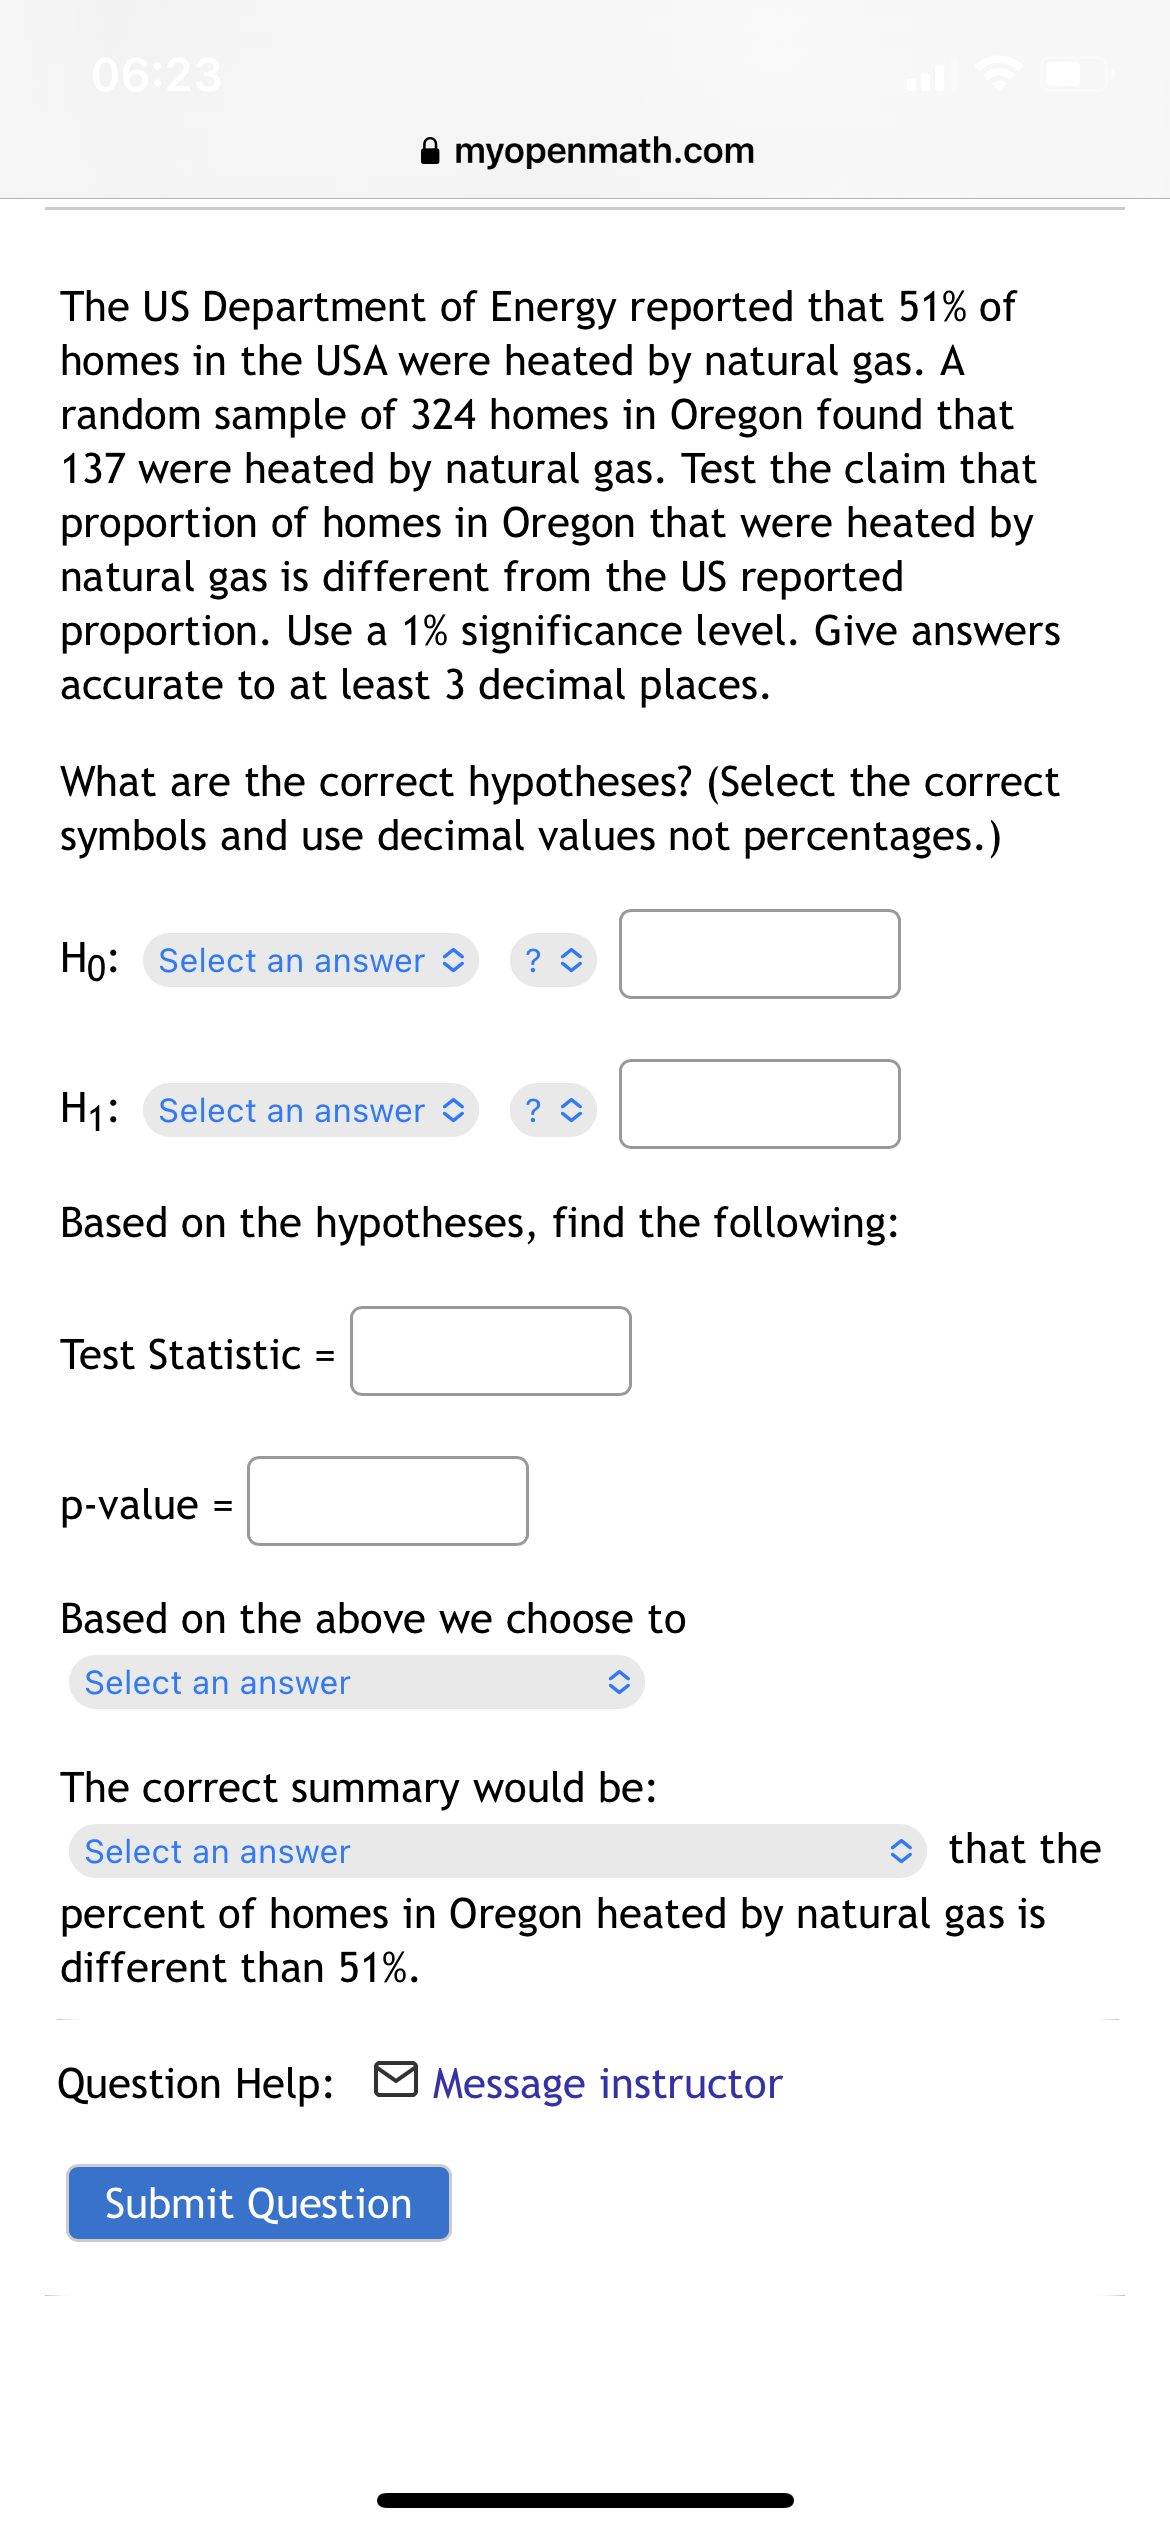
The US Department of Energy reported that 51% of
homes in the USA were heated by natural gas. A
random sample of 324 homes in Oregon found that
137 were heated by natural gas. Test the claim that
proportion of homes in Oregon that were heated by
natural gas is different from the US reported
proportion. Use a 1% significance level. Give answers
accurate to at least 3 decimal places.
What are the correct hypotheses? (Select the correct
symbols and use decimal values not percentages.)
Ho: Select an answer >
H1: Select an answer O
? O
Based on the hypotheses, find the following:
Test Statistic
p-value =
Based on the above we choose to
Select an answer
The correct summary would be:
Select an answer
O that the
percent of homes in Oregon heated by natural gas is
different than 51%.
Question Help: M Message instructor
Submit Question
Expert Solution
This question has been solved!
Explore an expertly crafted, step-by-step solution for a thorough understanding of key concepts.

This is a popular solution

Trending nowThis is a popular solution!

Step by stepSolved in 2 steps with 2 images

Knowledge Booster

Similar questions
- It has been claimed that at a university at least 40% of the students live on campus. In a random sample of 250 students, 90 were found to live on campus. What is the test value for testing the claim at a=.02? O A. - 2.33 B. 1.32 O C. -1.32 O D. - 1.29arrow_forwardSuppose you take a sample of 25 Reese's pieces. The proportion of orange is 0.4. What is the p-value when testing the hypothesis that the actual proportion of orange for all Reese's pieces is 0.5? Round to two places.arrow_forwardHow many Biology students’ records need to be sampled to estimate the percentage who earn "A"s to within 4.5% with 98% confidence?arrow_forward
- A study was conducted to see of airbags save lives. The table below lists the results from a simple random sample of front-seat occupants involved in car crashes. Airbag Available No Airbag Available Occupant Fatalities 41 52 Total number of occupants 11,541 9,853 What is the sample proportion of fatalities where there were no airbags available, p2? What is the difference in the two proportions, D? What is the standard error of the difference, SED?arrow_forwardYou conduct a cross-sectional study of 850 patients to test a new screening tool for diabetes. In addition to your screening tool, you administer an HbA1c test to diagnose diabetes. 412 patients had diabetes; 43 of those people had false negative screens. 850-412 patients did not have diabetes; 60 had false positives. Calculate the sensitivity of this test. Report your results as a percentage with no decimals and do not include a percentage sign. Your Answer:arrow_forwardThe state education commission wants to estimate the fraction of tenth grade students that have reading skills at or below the eighth grade level. Suppose a sample of 2552 tenth graders is drawn. Of the students sampled, 2119 read above the eighth grade level. Using the data, estimate the proportion of tenth graders reading at or below the eighth grade level. Enter your answer as a fraction or a decimal number rounded to three decimal places.arrow_forward
- An epidemiologist wants to estimate the proportion of residents in her city that carry the Hepatatis A virus. It is thought that the proportion is approximately 31%. How large a sample of residents should be taken to estimate the proportion who carry the Hepatitis A virus to within 10 percentage points with 98% confidence?arrow_forwardUse the information below, gathered from 1000 students from a small college who disclosed their age as well as their preference for type of instruction, to determine whether or not there is an association between age and preferred type of instruction. Write your hypotheses, perform the test, find the test statistic, the p-value, and state your conclusion. Assume a significance level of � = 0.01. AGE 18 & under 19-25 26-35 36-45 65 or Older online 43 56 26 20 20 Scheduled Zoom 48 75 34 26 20 Hybrid Zoom 82 19 88 83 59 Face to Face 27 50 52 71 101 a) Write your hypotheses.b) Use your calculator to determine the test statistic and p-value.c) Using the significance level provided, write an appropriate conclusionarrow_forwardThe accompanying table contains the data for the amounts (in oz) in cans of a certain soda. The cans are labeled to indicate that the contents are 16 oz of soda. Use the sign test and a 0.01 significance level to test the claim that cans of this soda are filled so that the median amount is 16 oz. If the median is not 16 oz, are consumers being cheated? Click the icon to view the data. What are the null and alternative hypotheses? O A. Ho: Median volume ≤ 16 oz H₁: Median volume = 16 oz C. Ho: Median volume = 16 oz H₁: Median volume # 16 oz Find the test statistic. Test statistic (Round to three decimal places as needed.) = More Info 15.6 16.0 16.1 16.1 407 15.7 (…) 16.1 15.9 19:3 15.8 16.5 15.8 15.7 15.9 OB. Ho: Median volume ≤ 16 oz H₁: Median volume > 16 oz O D. Ho: Median volume = 16 oz H₁: Median volume < 16 oz Volume (in ounces) 15.7 15.5 15.7 15.7 15.8 420 15.9 103 16.3 15.7 15.7 16.1 16.3 15.8 15.7 15.6 15.5 15.6 15.5 20 16.0 400 15.8 19:0 15.6 15.6 15.5 16.4 15.9 D - Xarrow_forward
arrow_back_ios
arrow_forward_ios
Recommended textbooks for you
- MATLAB: An Introduction with ApplicationsStatisticsISBN:9781119256830Author:Amos GilatPublisher:John Wiley & Sons Inc
 Probability and Statistics for Engineering and th...StatisticsISBN:9781305251809Author:Jay L. DevorePublisher:Cengage Learning
 Statistics for The Behavioral Sciences (MindTap C...StatisticsISBN:9781305504912Author:Frederick J Gravetter, Larry B. WallnauPublisher:Cengage Learning
  Elementary Statistics: Picturing the World (7th E...StatisticsISBN:9780134683416Author:Ron Larson, Betsy FarberPublisher:PEARSON
 The Basic Practice of StatisticsStatisticsISBN:9781319042578Author:David S. Moore, William I. Notz, Michael A. FlignerPublisher:W. H. Freeman
 Introduction to the Practice of StatisticsStatisticsISBN:9781319013387Author:David S. Moore, George P. McCabe, Bruce A. CraigPublisher:W. H. Freeman
MATLAB: An Introduction with Applications
Statistics
ISBN:9781119256830
Author:Amos Gilat
Publisher:John Wiley & Sons Inc
Probability and Statistics for Engineering and th...
Statistics
ISBN:9781305251809
Author:Jay L. Devore
Publisher:Cengage Learning
Statistics for The Behavioral Sciences (MindTap C...
Statistics
ISBN:9781305504912
Author:Frederick J Gravetter, Larry B. Wallnau
Publisher:Cengage Learning
Elementary Statistics: Picturing the World (7th E...
Statistics
ISBN:9780134683416
Author:Ron Larson, Betsy Farber
Publisher:PEARSON
The Basic Practice of Statistics
Statistics
ISBN:9781319042578
Author:David S. Moore, William I. Notz, Michael A. Fligner
Publisher:W. H. Freeman
Introduction to the Practice of Statistics
Statistics
ISBN:9781319013387
Author:David S. Moore, George P. McCabe, Bruce A. Craig
Publisher:W. H. Freeman