Calculus: Early Transcendentals
8th Edition
ISBN: 9781285741550
Author: James Stewart
Publisher: Cengage Learning
expand_more
expand_more
format_list_bulleted
Concept explainers
Topic Video
Question
Please show step by step.
Subpart Viii and Viiii please

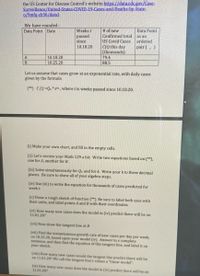
Transcribed Image Text:the US Center for Disease Control's website https://data.cdc.gov/Case-
Surveillance/United-States-COVID-19-Cases-and-Deaths-by-State-
o/9mfq-cb36/data).
We have rounded:
Data Point Date
# of new
Confirmed total
US Covid Cases
Weeks t
Data Point
passed
since
as an
ordered
10.18.20
C(t) this day
(thousands)
79.4
pair ( , )
10.18.20
B
10.25.20
88.5
Let us assume that cases grow at an exponential rate, with daily cases
given by the formula
(**) C (t) =Qo * ekt, where t is weeks passed since 10.18.20.
(i) Make your own chart, and fill in the empty cells.
(ii) Let's review your Math 129 a bit: Write two equations based on (**),
one for A, another for B.
(iii) Solve simultaneously for Qo and for k. Write your k to three decimal
places. Be sure to show all of your algebra steps.
(iv) Use (iii) to write the equation for thousands of cases predicted for
week t.
(v) Draw a rough sketch of function (**). Be sure to label both axes with
their units, and label points A and B with their coordinates.
(vi) How many new cases does the mcdel in (iv) predict there will be on
11.01.20?
(vii) Now draw the tangent line at B.
(vii) Find the instantaneous growth rate of new cases per day per week,
on 10.25.20, based upon your model (iv). Answer in a complete
sentence, and then find the equation of this tangent line, and label it on
your sketch.
(viii) How many new cases would the tangent line predict there will be
on 11.01.20? We call the tangent line's values a "linear model".
(ix) How many new cases does the model in (iv) predict there will be on
11.01.20?
Expert Solution
This question has been solved!
Explore an expertly crafted, step-by-step solution for a thorough understanding of key concepts.
This is a popular solution
Trending nowThis is a popular solution!
Step by stepSolved in 4 steps with 3 images

Knowledge Booster
Learn more about
Need a deep-dive on the concept behind this application? Look no further. Learn more about this topic, calculus and related others by exploring similar questions and additional content below.Similar questions
arrow_back_ios
arrow_forward_ios
Recommended textbooks for you
 Calculus: Early TranscendentalsCalculusISBN:9781285741550Author:James StewartPublisher:Cengage Learning
 Thomas' Calculus (14th Edition)CalculusISBN:9780134438986Author:Joel R. Hass, Christopher E. Heil, Maurice D. WeirPublisher:PEARSON
 Calculus: Early Transcendentals (3rd Edition)CalculusISBN:9780134763644Author:William L. Briggs, Lyle Cochran, Bernard Gillett, Eric SchulzPublisher:PEARSON
 Calculus: Early TranscendentalsCalculusISBN:9781319050740Author:Jon Rogawski, Colin Adams, Robert FranzosaPublisher:W. H. Freeman
 Calculus: Early Transcendental FunctionsCalculusISBN:9781337552516Author:Ron Larson, Bruce H. EdwardsPublisher:Cengage Learning

Calculus: Early Transcendentals
Calculus
ISBN:9781285741550
Author:James Stewart
Publisher:Cengage Learning

Thomas' Calculus (14th Edition)
Calculus
ISBN:9780134438986
Author:Joel R. Hass, Christopher E. Heil, Maurice D. Weir
Publisher:PEARSON

Calculus: Early Transcendentals (3rd Edition)
Calculus
ISBN:9780134763644
Author:William L. Briggs, Lyle Cochran, Bernard Gillett, Eric Schulz
Publisher:PEARSON

Calculus: Early Transcendentals
Calculus
ISBN:9781319050740
Author:Jon Rogawski, Colin Adams, Robert Franzosa
Publisher:W. H. Freeman


Calculus: Early Transcendental Functions
Calculus
ISBN:9781337552516
Author:Ron Larson, Bruce H. Edwards
Publisher:Cengage Learning