Microeconomics A Contemporary Intro
10th Edition
ISBN: 9781285635101
Author: MCEACHERN
Publisher: Cengage
expand_more
expand_more
format_list_bulleted
Question

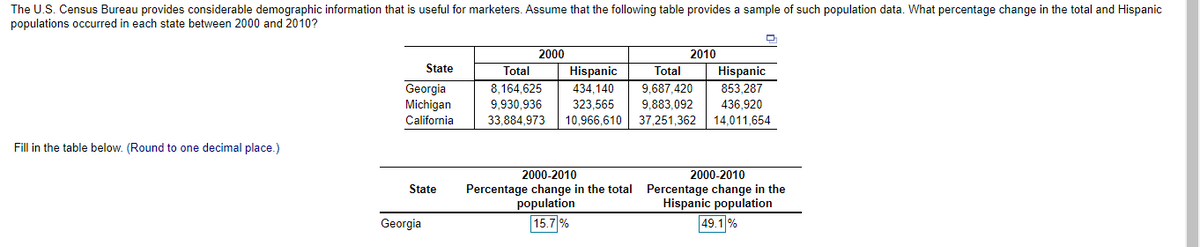
Transcribed Image Text:The U.S. Census Bureau provides considerable demographic information that is useful for marketers. Assume that the following table provides a sample of such population data. What percentage change in the total and Hispanic
populations occurred in each state between 2000 and 2010?
2000
2010
State
Total
Hispanic
Total
9,687,420
9.883.092
37,251,362
Hispanic
853.287
436,920
14,011,654
Georgia
Michigan
8,164,625
9,930,936
33.884,973
434.140
323,565
California
10,966,610
Fill in the table below. (Round to one decimal place.)
2000-2010
2000-2010
State
Percentage change in the total Percentage change in the
Hispanic population
population
Georgia
15.7 %
49.1%
Expert Solution

This question has been solved!
Explore an expertly crafted, step-by-step solution for a thorough understanding of key concepts.
This is a popular solution
Trending nowThis is a popular solution!
Step by stepSolved in 2 steps

Knowledge Booster
Similar questions
- How is absolute poverty measured, in comparison to the distribution of national income? Write down a statistic for each measurement. List 3 countries in Latin America with extremely high rates of absolute poverty and 3 countries with very high income inequality. What are 2 factors which may have increased absolute poverty rates throughout the region’s history? Finally, provide 2 factors which have increased income inequality in Latin America throughout its history.arrow_forwardWorld Bank data show that in 1995, the poorest 20% of households accounted for 7.5% of household income in Niger, the next 20% of households accounted for 11.8% of income, the middle 20% accounted for 15.5% of income, the second richest 20% accounted for 21.1% of income, and the top 20% accounted for 44.1% of income. What was the cumulative income share of the bottom 60% of households in Niger? 2. Draw a Lorenz curve and calculate the Gini coefficient for Niger.arrow_forwardThe data in the table characterizes the income distribution for a country. What percentage of the total population is categorized as belonging to the second quintile? Give your responses as whole numbers. Income category Share of income (%) Cumulative share of income (%) first quintile 7.0 --- second quintile 9.0 16.0 third quintile --- 35.0 fourth quintile 25.0 --- fifth quintile 40.0 --- percentage of population in second quintile: % What percentage of the total income for the country is earned by the third quintile? percentage earned by the third quintile: % What is the cumulative share of income earned by the poorest 80% of the population? percentage earned by the poorest 80%: %arrow_forward
- I'm not sure if I am answering this question correctly, or how to graph it.arrow_forwardAnswer below questions with reference to the following figure, which reports population change in Australia (by age groups) over the period 1999 to 2019. What does the population pyramid indicate about Australia’s age structure? What is the potential implication of the observed age structure for Australia’s dependency ratio (youth versus elderly dependency ratio)? What does the population pyramid indicate about the stage of demographic transition in Australia?arrow_forwardWhat percentage of the total population is categorized as belonging to the second quintile? Give your responses as whole numbers. The data in the table characterizes the income distribution for a country. Income category first quintile Share of income Cumulative share of (%) income (%) 7.0 second quintile 15.0 22.0 third quintile 45.0 fourth quintile 29.0 fifth quintile 26.0 percentage of population in second quintile: % What percentage of the total income for the country is earned by the third quintile? percentage earned by the third quintile: % What is the cumulative share of income earned by the poorest 80% of the population? percentage earned by the poorest 80%: ୪୧arrow_forward
- Category Number of Persons Part Time Employees 30 million People Looking for Work in the last 4 weeks and Have not Worked in the Last Week 9.2 million Full Time Employees 101 million Retirees 15.8 million Full Time Students 13 million Workers that haven't looked because they are marginally attached 4.9 million Workers that haven't looked because they are discouraged 4.1 million Assume the table above includes the population of all individuals age 16 or older in this country. What is the labor force participation rate (as a percentage, but omit the % sign, rounded to the nearest tenth)? Note:- Please give me proper calculation with correct answer otherwise i give downvote Please avoid using ChatGPT and refrain from providing handwritten solutions; otherwise, I will definitely give a downvote. Also, be mindful of plagiarism. Answer completely and accurate answer. Rest assured, you will receive an upvote if the answer is accurate.arrow_forwardThe table below shows information about the distribution of income in two countries. The rows are labeled "deciles" which are like percentiles but for groups of 10% instead of 1% of the population. The 1St decile is the poorest 10%, for example, while the 10th decile is the richest 10%. Coruscant Naboo cumulative income cumulative income decile income share share income share share 1st 2.29% 2.29% 3.12% 3.12% 2nd 3.93% 6.22% 4.50% 7.62% 3rd 5.30% 11.52% 5.69% 13.31% 4th 6.56% 18.08% 6.80% 20.11% 5th 7.81% 25.89% 7.91% 28.02% 6th 9.14% 35.04% 9.11% 37.13% 7th 10.69% 45.73% 10.52% 47.65% 8th 12.71% 58.44% 12.37% 60.02% 9th 15.94% 15.32% 10th 25.61% 24.66% mean income = 50,000 35,000 What is the cumulative income share for the bottom 9 deciles in Naboo?arrow_forwardFIGURE 12.5 U.S. Racial-Ethnic Groups Americans of European Descent German 50,272,000 16.5% Irish 36,278,000 11.9% 199,491,000 65% English/British 28,630,000 9.4% Italian 17,749,000 5.8% French 11,526,000 3.8% Polish 9,887,000 3.25% Scottishd 9,365,000 3.1% Dutch 4,929,000 1.6% Norwegian 4,643,000 1.5% Swedish 4,390,000 1.4% Russian 3,130,000 1.0% Welsh 1,980,000 0.6% Czech 1,914,000 0.5% Hungarian 1,539,000 0.5% Danish 1,459,000 0.5% Portuguese 1,419,000 0.5% Greek 1,351,000 0.4% 997,000 839,300 Swiss 0.3% Others 0.2% Americans of African, Asian, North, Central, and South American, and Pacific Island Descent Latino 46,944,000 15.4% African American 39,059,000 12.8% Asian American 13,549,000 4.5% Native American9 3,083,000 1.0% 104,743,000 34% Arab 1,546,000 0.5% Claim Two or More Race-Ethnicities 5,167,000 1.7% Overall Total: 4% 8% 12% 16% 20% 309,401,000 Percentage of Americans Source: By the author, Based on Statistical Abstract of the United States 2010:Table 10; 2011:Table 52. 4)…arrow_forward
- 5. Can i get help with this practice question i am working on.arrow_forwardThe following is the gender distribution obtained from the class rosters for all sections of a statistics course. Female = 1, Male = 0 0 1 1 0 1 0 0 1 1 1 0 0 0 1 0 0 0 0 1 0 1 0 0 1 1 1 0 0 1 0 1 1 0 0 0 1 0 0 0 0 0 1 0 0 0 0 0 0 0 0 1 1 0 0 1 0 1 1 1 0 0 1 0 1 0 1 0 0 0 0 1 1 1 1 1 1 0 0 0 1 1 0 1 0 1 0 0 0 1 0 0 0 0 0 0 0 0 0 1 0 0 1 1 1 0 0 0 0 1 0 0 1 0 0 0 0 1 1 1 0 0 1 0 1 0 0 1 0 0 1 1 0 0 1 1 1 1 1 0 1 1 0 0 0 0 0 1 1 0 0 1 0 1 1 1 0 1 0 1 0 0 1 0 0 1 0 0 0 0 0 0 0 0 0 0 0 0 0 0 0 25 How many students are enrolled in this class? a 180 b 184 c 188 d 192arrow_forwardThe following is the gender distribution obtained from the class rosters for all sections of a statistics course. Female = 1, Male = 0 0 1 1 0 1 0 0 1 1 1 0 0 0 1 0 0 0 0 1 0 1 0 0 1 1 1 0 0 1 0 1 1 0 0 0 1 0 0 0 0 0 1 0 0 0 0 0 0 0 0 1 1 0 0 1 0 1 1 1 0 0 1 0 1 0 1 0 0 0 0 1 1 1 1 1 1 0 0 0 1 1 0 1 0 1 0 0 0 1 0 0 0 0 0 0 0 0 0 1 0 0 1 1 1 0 0 0 0 1 0 0 1 0 0 0 0 1 1 1 0 0 1 0 1 0 0 1 0 0 1 1 0 0 1 1 1 1 1 0 1 1 0 0 0 0 0 1 1 0 0 1 0 1 1 1 0 1 0 1 0 0 1 0 0 1 0 0 0 0 0 0 0 0 0 0 0 0 0 0 0 26 How many are MALE? a 106 b 108 c 110 d 112arrow_forward
arrow_back_ios
SEE MORE QUESTIONS
arrow_forward_ios
Recommended textbooks for you
- Principles of MicroeconomicsEconomicsISBN:9781305156050Author:N. Gregory MankiwPublisher:Cengage LearningPrinciples of Economics (MindTap Course List)EconomicsISBN:9781305585126Author:N. Gregory MankiwPublisher:Cengage Learning
- Principles of Microeconomics (MindTap Course List)EconomicsISBN:9781305971493Author:N. Gregory MankiwPublisher:Cengage LearningPrinciples of Economics, 7th Edition (MindTap Cou...EconomicsISBN:9781285165875Author:N. Gregory MankiwPublisher:Cengage Learning

Principles of Microeconomics
Economics
ISBN:9781305156050
Author:N. Gregory Mankiw
Publisher:Cengage Learning

Principles of Economics (MindTap Course List)
Economics
ISBN:9781305585126
Author:N. Gregory Mankiw
Publisher:Cengage Learning

Principles of Microeconomics (MindTap Course List)
Economics
ISBN:9781305971493
Author:N. Gregory Mankiw
Publisher:Cengage Learning

Principles of Economics, 7th Edition (MindTap Cou...
Economics
ISBN:9781285165875
Author:N. Gregory Mankiw
Publisher:Cengage Learning