
MATLAB: An Introduction with Applications
6th Edition
ISBN: 9781119256830
Author: Amos Gilat
Publisher: John Wiley & Sons Inc
expand_more
expand_more
format_list_bulleted
Related questions
Question
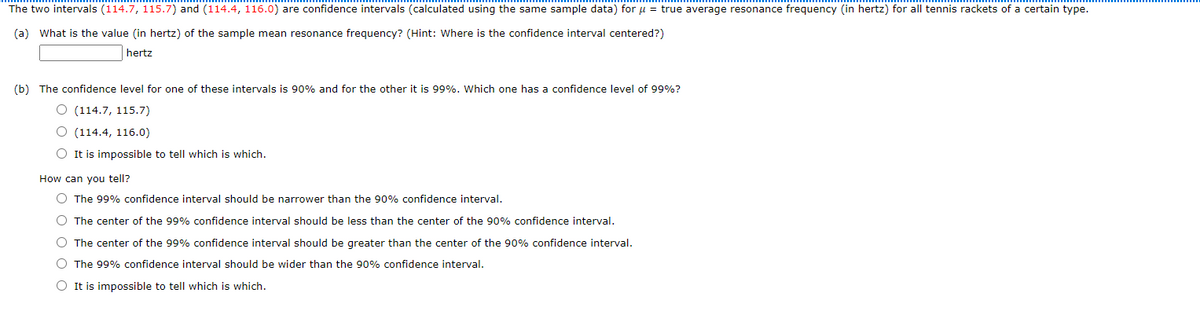

Transcribed Image Text:The two intervals (114.7, 115.7) and (114.4, 116.0) are confidence intervals (calculated using the same sample data) for u = true average resonance frequency (in hertz) for all tennis rackets of a certain type.
(a) What is the value (in hertz) of the sample mean resonance frequency? (Hint: Where is the confidence interval centered?)
hertz
(b) The confidence level for one of these intervals is 90% and for the other it is 99%. Which one has a confidence level of 99%?
O (114.7, 115.7)
O (114.4, 116.0)
O It is impossible to tell which is which.
How can you tell?
O The 99% confidence interval should be narrower than the 90% confidence interval.
O The center of the 99% confidence interval should be less than the center of the 90% confidence interval.
O The center of the 99% confidence interval should be greater than the center of the 90% confidence interval.
O The 99% confidence interval should be wider than the 90% confidence interval.
O It is impossible to tell which is which.
Expert Solution
This question has been solved!
Explore an expertly crafted, step-by-step solution for a thorough understanding of key concepts.

This is a popular solution

Trending nowThis is a popular solution!

Step by stepSolved in 4 steps with 4 images

Knowledge Booster


Learn more about
Need a deep-dive on the concept behind this application? Look no further. Learn more about this topic, statistics and related others by exploring similar questions and additional content below.Similar questions
- Question 5 Assume that a sample is used to estimate a population mean p. Find the 90% confidence interval for a sample of size 71 with a mean of 57.2 and a standard deviation of 20.7. Enter your answer as an open- interval (i.e., parentheses) accurate to one decimal place (because the sample statistics are reported accurate to one decimal place). 90% C.I. %3D Answer should be obtained without any preliminary rounding. However, the critical value may be rounded to 3 decimal places. Submit Questionarrow_forwardQuestion 8 1p Find the indicated critical z value. Find the value of za2 that corresponds to a confidence level of 92.50%. O 0.0375 0 1.78 O-1.78 -1,78 0 1.44arrow_forwardQuestion 8 A researcher must estimate the mean temperature (in degrees Fahrenheit) with the following sample temperatures: 22.6 59.2 40.9 17.3 64.2 |35.6 Assuming the population of temperatures are normally distributed, find the 80% confidence interval. Round the answers to two decimal places. Enter your answer as an interval of the form (LB,UP). The researcher is 80% confident that the population average temperature is within the temperature interval Question Help: DVideo Submit Question 1jpgarrow_forward
- Please answer the questions carefully to get the correct answers for the Bootstrap correlation.arrow_forwardFind the confidence interval for a Related-Samples t-test (Ch.11), given the following info: Level of confidence = 99% Before and After scores = see table below SSD (SS of the difference scores) = 2.75 Hint: as you’re doing calculations, don’t round any numbers in your calculations to less than two decimal places, or your final answer may be too rounded for you to be able to tell which answer below is correct. Person Before X1 After X2 Difference (D = X2- X1) A 15 22 +7 B 18 23 +5 C 12 17 +5 D 17 23 +6 A. 1.90 < μD < 7.18 B. 2.53 < μD < 8.02 C. 2.95 < μD < 8.55 D. 2.01 < μD < 7.58arrow_forward
arrow_back_ios
arrow_forward_ios
Recommended textbooks for you
- MATLAB: An Introduction with ApplicationsStatisticsISBN:9781119256830Author:Amos GilatPublisher:John Wiley & Sons Inc
 Probability and Statistics for Engineering and th...StatisticsISBN:9781305251809Author:Jay L. DevorePublisher:Cengage Learning
 Statistics for The Behavioral Sciences (MindTap C...StatisticsISBN:9781305504912Author:Frederick J Gravetter, Larry B. WallnauPublisher:Cengage Learning
  Elementary Statistics: Picturing the World (7th E...StatisticsISBN:9780134683416Author:Ron Larson, Betsy FarberPublisher:PEARSON
 The Basic Practice of StatisticsStatisticsISBN:9781319042578Author:David S. Moore, William I. Notz, Michael A. FlignerPublisher:W. H. Freeman
 Introduction to the Practice of StatisticsStatisticsISBN:9781319013387Author:David S. Moore, George P. McCabe, Bruce A. CraigPublisher:W. H. Freeman
MATLAB: An Introduction with Applications
Statistics
ISBN:9781119256830
Author:Amos Gilat
Publisher:John Wiley & Sons Inc
Probability and Statistics for Engineering and th...
Statistics
ISBN:9781305251809
Author:Jay L. Devore
Publisher:Cengage Learning
Statistics for The Behavioral Sciences (MindTap C...
Statistics
ISBN:9781305504912
Author:Frederick J Gravetter, Larry B. Wallnau
Publisher:Cengage Learning
Elementary Statistics: Picturing the World (7th E...
Statistics
ISBN:9780134683416
Author:Ron Larson, Betsy Farber
Publisher:PEARSON
The Basic Practice of Statistics
Statistics
ISBN:9781319042578
Author:David S. Moore, William I. Notz, Michael A. Fligner
Publisher:W. H. Freeman
Introduction to the Practice of Statistics
Statistics
ISBN:9781319013387
Author:David S. Moore, George P. McCabe, Bruce A. Craig
Publisher:W. H. Freeman