Applications and Investigations in Earth Science (9th Edition)
9th Edition
ISBN: 9780134746241
Author: Edward J. Tarbuck, Frederick K. Lutgens, Dennis G. Tasa
Publisher: PEARSON
expand_more
expand_more
format_list_bulleted
Question
12

- **Temperature Data (°C):**
- Highest Temperature: ~30°C (July)
- Lowest Temperature: ~-10°C (December)
- **Precipitation Data (cm):**
- Highest Precipitation: ~20 cm (July)
- Lowest Precipitation: ~1-2 cm (Winter months)

- **Temperature Data (°C):**
- Highest Temperature: ~30°C (January)
- Lowest Temperature: ~-10°C (July)
- **Precipitation Data (cm):**
- Highest Precipitation: ~20 cm (July)
- Lowest Precipitation: ~1-2 cm (Winter months)
### Analysis
**Temperature Trends:**
- **Climograph 1:** Temperatures peak around July and dip around December, indicating a warm summer and cold winter, suggestive of a Northern Hemisphere location.
- **Climograph 2:** Temperatures peak around January and dip around July, indicative of a warm summer and cold winter consistent with a Southern Hemisphere location.
**Precipitation Patterns:**
- Both climographs show similar precipitation patterns, peaking in July and remaining low during the winter months.
### Conclusion
**Climograph 1** represents the Northern Hemisphere location as evidenced by the temperature peak during July and the dip during December.](https://content.bartleby.com/qna-images/question/5cbb7168-36a6-47ab-92ab-442925d6273e/60230a3f-73eb-4672-9d04-1e340e67ff75/19a74qp_thumbnail.jpeg)
Transcribed Image Text:### Identifying Climate and Hemisphere: An Analysis
The two climographs below represent the same climate at two different locations. Which one represents a northern hemisphere location (temperature is measured in °C, precipitation in cm)?
#### Climograph 1

- **Temperature Data (°C):**
- Highest Temperature: ~30°C (July)
- Lowest Temperature: ~-10°C (December)
- **Precipitation Data (cm):**
- Highest Precipitation: ~20 cm (July)
- Lowest Precipitation: ~1-2 cm (Winter months)

- **Temperature Data (°C):**
- Highest Temperature: ~30°C (January)
- Lowest Temperature: ~-10°C (July)
- **Precipitation Data (cm):**
- Highest Precipitation: ~20 cm (July)
- Lowest Precipitation: ~1-2 cm (Winter months)
### Analysis
**Temperature Trends:**
- **Climograph 1:** Temperatures peak around July and dip around December, indicating a warm summer and cold winter, suggestive of a Northern Hemisphere location.
- **Climograph 2:** Temperatures peak around January and dip around July, indicative of a warm summer and cold winter consistent with a Southern Hemisphere location.
**Precipitation Patterns:**
- Both climographs show similar precipitation patterns, peaking in July and remaining low during the winter months.
### Conclusion
**Climograph 1** represents the Northern Hemisphere location as evidenced by the temperature peak during July and the dip during December.

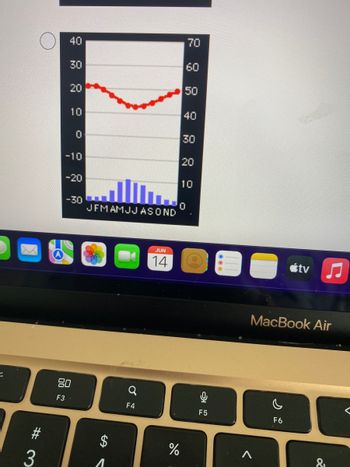
Transcribed Image Text:### Monthly Temperature and Precipitation Analysis
#### Temperature and Precipitation Data Overview
The image depicts a combined graph illustrating monthly temperature and precipitation data over the span of a year.
1. **X-axis**: Months of the Year
- **Labels**: J (January), F (February), M (March), A (April), M (May), J (June), J (July), A (August), S (September), O (October), N (November), D (December)
2. **Primary Y-axis (Left Side)**: Temperature (°C)
- **Range**: -30°C to 40°C
- **Label Color**: Black
3. **Secondary Y-axis (Right Side)**: Precipitation (mm)
- **Range**: 0 mm to 70 mm
- **Label Color**: White
#### Graph Details:
**Temperature Trend (Red Line with Dots)**
- **Highs and Lows**:
- The trend starts high at around 20°C in January and February.
- The temperature dips to its lowest point (~10°C) in June.
- Thereafter, it rises again, reaching about 20°C by December.
**Precipitation Trend (Blue Bars)**
- **Monthly Distribution**:
- Precipitation is highest in March (~25 mm).
- It diminishes gradually from April, reaching its minimum around August.
- There is an increase in precipitation starting from September till December.
### Interpretation
This graph provides a clear visualization of the typical climatic patterns, showing the variation in temperature and precipitation throughout the year. The data can be useful for understanding seasonal weather patterns, planning agricultural activities, or preparing for weather-related events.
Learn more about this data in our comprehensive climate study section.
---
*Note: This educational material is based on an image displaying a graph with temperature and precipitation data. Be sure to reference the original data set for precise numerical values.*
Expert Solution
This question has been solved!
Explore an expertly crafted, step-by-step solution for a thorough understanding of key concepts.
This is a popular solution
Trending nowThis is a popular solution!
Step by stepSolved in 2 steps

Knowledge Booster
Recommended textbooks for you
 Applications and Investigations in Earth Science ...Earth ScienceISBN:9780134746241Author:Edward J. Tarbuck, Frederick K. Lutgens, Dennis G. TasaPublisher:PEARSON
 Exercises for Weather & Climate (9th Edition)Earth ScienceISBN:9780134041360Author:Greg CarbonePublisher:PEARSON
 Environmental ScienceEarth ScienceISBN:9781260153125Author:William P Cunningham Prof., Mary Ann Cunningham ProfessorPublisher:McGraw-Hill Education
 Earth Science (15th Edition)Earth ScienceISBN:9780134543536Author:Edward J. Tarbuck, Frederick K. Lutgens, Dennis G. TasaPublisher:PEARSON
 Environmental Science (MindTap Course List)Earth ScienceISBN:9781337569613Author:G. Tyler Miller, Scott SpoolmanPublisher:Cengage Learning
 Physical GeologyEarth ScienceISBN:9781259916823Author:Plummer, Charles C., CARLSON, Diane H., Hammersley, LisaPublisher:Mcgraw-hill Education,

Applications and Investigations in Earth Science ...
Earth Science
ISBN:9780134746241
Author:Edward J. Tarbuck, Frederick K. Lutgens, Dennis G. Tasa
Publisher:PEARSON

Exercises for Weather & Climate (9th Edition)
Earth Science
ISBN:9780134041360
Author:Greg Carbone
Publisher:PEARSON

Environmental Science
Earth Science
ISBN:9781260153125
Author:William P Cunningham Prof., Mary Ann Cunningham Professor
Publisher:McGraw-Hill Education

Earth Science (15th Edition)
Earth Science
ISBN:9780134543536
Author:Edward J. Tarbuck, Frederick K. Lutgens, Dennis G. Tasa
Publisher:PEARSON

Environmental Science (MindTap Course List)
Earth Science
ISBN:9781337569613
Author:G. Tyler Miller, Scott Spoolman
Publisher:Cengage Learning

Physical Geology
Earth Science
ISBN:9781259916823
Author:Plummer, Charles C., CARLSON, Diane H., Hammersley, Lisa
Publisher:Mcgraw-hill Education,