
MATLAB: An Introduction with Applications
6th Edition
ISBN: 9781119256830
Author: Amos Gilat
Publisher: John Wiley & Sons Inc
expand_more
expand_more
format_list_bulleted
Related questions
Question
The time required for a citizen to complete a 2000 U.S. Census “long” form is
a.
0.0174
b.
0.0228
c.
0.9826
d.
0.9772
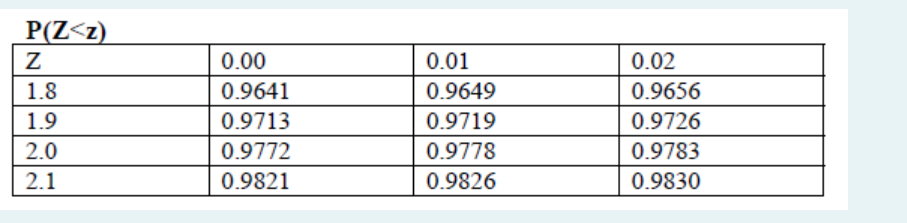

Transcribed Image Text:The image is a table representing the probability values for a standard normal distribution, often referred to as a Z-table. It shows the cumulative probabilities \( P(Z < z) \) for specific Z-scores.
The columns represent the decimal part of the Z-score: 0.00, 0.01, and 0.02. The rows represent the integer and first decimal of the Z-score: 1.8, 1.9, 2.0, and 2.1.
Here's the table breakdown:
- For \( Z = 1.8 \):
- \( P(Z < 1.80) = 0.9641 \)
- \( P(Z < 1.81) = 0.9649 \)
- \( P(Z < 1.82) = 0.9656 \)
- For \( Z = 1.9 \):
- \( P(Z < 1.90) = 0.9713 \)
- \( P(Z < 1.91) = 0.9719 \)
- \( P(Z < 1.92) = 0.9726 \)
- For \( Z = 2.0 \):
- \( P(Z < 2.00) = 0.9772 \)
- \( P(Z < 2.01) = 0.9778 \)
- \( P(Z < 2.02) = 0.9783 \)
- For \( Z = 2.1 \):
- \( P(Z < 2.10) = 0.9821 \)
- \( P(Z < 2.11) = 0.9826 \)
- \( P(Z < 2.12) = 0.9830 \)
Expert Solution
This question has been solved!
Explore an expertly crafted, step-by-step solution for a thorough understanding of key concepts.

This is a popular solution

Trending nowThis is a popular solution!

Step by stepSolved in 3 steps

Knowledge Booster

Similar questions
- A company selling a new type of laptop battery advertises that it has a méan lifetime of 5 years. If you were in charge of quality control at the factory, which one of the following standard deviations of battery life spans would you prefer? 2 months. O 2 years O 5 years 27arrow_forwardThe household income in a particular town can be represented by a normal distribution with a mean of £50,000, and a standard deviation of £10,000. i. What is the probability that a particular household has an income level of more than £55,000? ii. What is the probability that a particular household has an income that is less than £35,000?arrow_forwardThe annual income for a sample of 450 part-time students is normally distributed with a mean income of $31,000 and a standard deviation of $3,000. What is the probability their annual income is more than $35,000?arrow_forward
- The Aluminum Association reports that the average American uses 56.8 pounds of aluminum in a year. A random sample of 50 households is monitored for one year to determine aluminum usage. If the population standard deviation of annual usage is 12.3 pounds, what is the probability that the sample mean will be each of the following? Appendix A Statistical Tables d. Less than 55 poundse. Less than 49 poundsarrow_forwardThe NJ Department of Health has reported the average life span of NJ residents is 81 years. If the standard deviation is σ = 4 years, what is the probability of a person living to at least 92 years of age?arrow_forward15arrow_forward
- One year consumers spent an average of $22 on a meal at a resturant. Assume that the amount spent on a resturant meal is normally distributed and that the standard deviation is $3.Complete parts (a) through (c) below. a. What is the probability that a randomly selected person spent more than $24?arrow_forwardPlease use the approporate stats table provided. Do not use a software for this problem. Q17: If the mean number of serious accidents per year in a large factory (where the number of employees remains constant) is five, find the probability that in the current year there will be:a. No accidents b. One accident c. Two or morearrow_forwardThe Aluminum Association reports that the average American uses 56.8 pounds of aluminum in a year. A random sample of 50 households is monitored for one year to determine aluminum usage. If the population standard deviation of annual usage is 12.3 pounds, what is the probability that the sample mean will be each of the following? Appendix A Statistical Tables a. More than 60 poundsb. More than 56 poundsc. Between 55 and 57 poundsarrow_forward
arrow_back_ios
arrow_forward_ios
Recommended textbooks for you
- MATLAB: An Introduction with ApplicationsStatisticsISBN:9781119256830Author:Amos GilatPublisher:John Wiley & Sons Inc
 Probability and Statistics for Engineering and th...StatisticsISBN:9781305251809Author:Jay L. DevorePublisher:Cengage Learning
 Statistics for The Behavioral Sciences (MindTap C...StatisticsISBN:9781305504912Author:Frederick J Gravetter, Larry B. WallnauPublisher:Cengage Learning
  Elementary Statistics: Picturing the World (7th E...StatisticsISBN:9780134683416Author:Ron Larson, Betsy FarberPublisher:PEARSON
 The Basic Practice of StatisticsStatisticsISBN:9781319042578Author:David S. Moore, William I. Notz, Michael A. FlignerPublisher:W. H. Freeman
 Introduction to the Practice of StatisticsStatisticsISBN:9781319013387Author:David S. Moore, George P. McCabe, Bruce A. CraigPublisher:W. H. Freeman
MATLAB: An Introduction with Applications
Statistics
ISBN:9781119256830
Author:Amos Gilat
Publisher:John Wiley & Sons Inc
Probability and Statistics for Engineering and th...
Statistics
ISBN:9781305251809
Author:Jay L. Devore
Publisher:Cengage Learning
Statistics for The Behavioral Sciences (MindTap C...
Statistics
ISBN:9781305504912
Author:Frederick J Gravetter, Larry B. Wallnau
Publisher:Cengage Learning
Elementary Statistics: Picturing the World (7th E...
Statistics
ISBN:9780134683416
Author:Ron Larson, Betsy Farber
Publisher:PEARSON
The Basic Practice of Statistics
Statistics
ISBN:9781319042578
Author:David S. Moore, William I. Notz, Michael A. Fligner
Publisher:W. H. Freeman
Introduction to the Practice of Statistics
Statistics
ISBN:9781319013387
Author:David S. Moore, George P. McCabe, Bruce A. Craig
Publisher:W. H. Freeman