
MATLAB: An Introduction with Applications
6th Edition
ISBN: 9781119256830
Author: Amos Gilat
Publisher: John Wiley & Sons Inc
expand_more
expand_more
format_list_bulleted
Related questions
Question
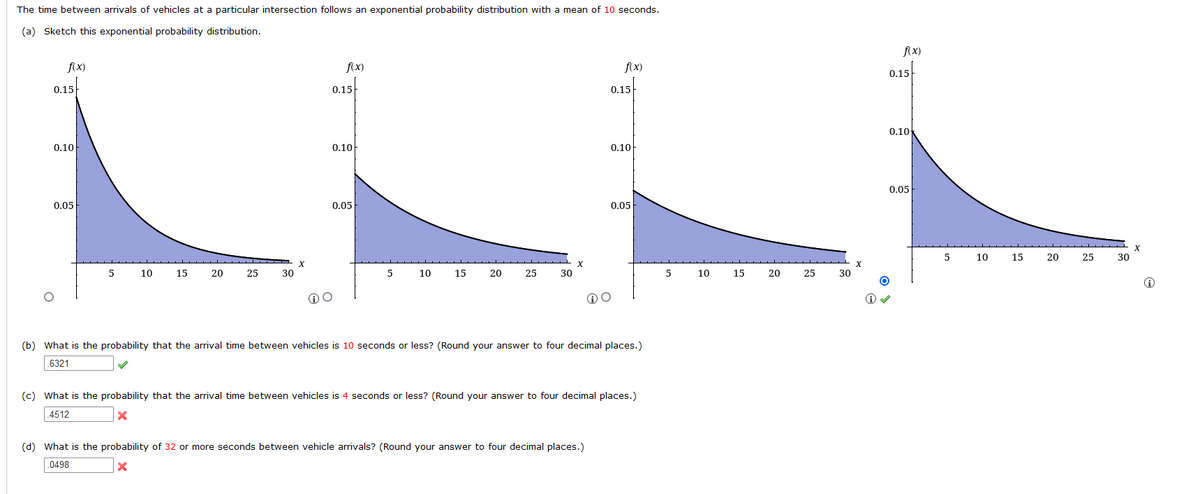

Transcribed Image Text:The time between arrivals of vehicles at a particular intersection follows an exponential probability distribution with a mean of
seconds.
(a) Sketch this exponential probability distribution.
f(x)
f(x)
f(x)
f(x)
0.15
0.15
0.15
0.15
0.10
0.10
0.10
0.10
0.05
0.05
0.05
0.05
5
10
15
20
25
30
5
10
15
20
25
30
5
10
15
20
25
30
5
10
15
20
25
30
(b) What is the probability that the arrival time between vehicles is 10 seconds or less? (Round your answer to four decimal places.)
.6321
(c) What is the probability that the arrival time between vehicles is 4 seconds or less? (Round your answer to four decimal places.)
.4512
(d) What is the probability of 32 or more seconds between vehicle arrivals? (Round your answer to four decimal places.)
.0498
Expert Solution
This question has been solved!
Explore an expertly crafted, step-by-step solution for a thorough understanding of key concepts.

This is a popular solution

Trending nowThis is a popular solution!

Step by stepSolved in 4 steps with 1 images

Knowledge Booster

Similar questions
- Find the mean of the following probability distribution. xx P(x)P(x) 0 0.1536 1 0.2644 2 0.1896 3 0.2421 4 0.1502 mean = xx P(x)P(x) 0 0.25 1 0.15 2 0.3 3 0.3 Find the mean of this probability distribution. Round your answer to one decimal place.arrow_forwardThe joint probability distribution of the number X of cars and the number Y of buses per signal cycle at a proposed left-turn lane is displayed in the accompanying joint probability table below. y P(xy) 1 2. 0. .025 .015 .010 .050 .030 020 2. .125 .075 050 3. 150 090 060 4. 100 .060 040 050 .030 .020 Suppose the left-turn lane is to have a capacity of six cars, and that one bus is equivalent to three cars. What is the probability of an overflow duringa cycle? Select one: O 48 O 28 O38 0.18arrow_forwardBenford's law, also known as the first-digit law, represents a probability distribution of the leading significant digits of numerical values in a data set. A leading significant digit is the first occurring non-zero integer in a number. For example, the leading significant digit in the number 127 is 1. Let this leading significant digit be denoted x. Benford's law notes that the frequencies of x in many datasets are approximated by the probability distribution shown in the table. 1 3 4 5 7 8 9. P(x) 0.301 | 0.176 | 0.125 | 0.097 0.079 | 0.067 0.058 0.051 | 0.046 Determine E(X), the expected value of the leading significant digit of a randomly selected data value in a dataset that behaves according to Benford's law? Please give your answer to the nearest three decimal places.arrow_forward
- What type of distribution does Y follow? A. Exponential B. Poisson C. Uniform D. Binomial E. Bernoulliarrow_forwardDetermine the required value of the missing probability to make the distribution a discrete probability distribution. P(4) = (Type an integer or a decimal.) X P(x) 3 0.16 4 ? 5 0.40 6 0.15 ...arrow_forward%23 The following table contains the probability distribution for the number of traffic accidents daily in a small town. Complete parts (a) through (c) below. Number of Accidents P(X= x;) Daily (X) 0.28 0.31 0.17 3 0.09 0.07 0.05 4 0.03 a. Compute the mean number of accidents per day. (Type an integer or a decimal. Do not round.) More data-3_24_2022-4..xlsx 67 F e Type here to seareharrow_forward
- Determine whether the following are valid probability models or not. Type "VALID" if it is valid, or type "INVALID" if it is not.arrow_forward1. A sample is used to construct a confidence interval for an unknown population mean. Which of the following is the least likely to result in a decrease in the margin of error? (a) Increasing the sample size (b) Increasing the confidence level (c) Decreasing the confidence level (d) A change in the standard deviation of the population. Answer to Question 1:arrow_forward
arrow_back_ios
arrow_forward_ios
Recommended textbooks for you
- MATLAB: An Introduction with ApplicationsStatisticsISBN:9781119256830Author:Amos GilatPublisher:John Wiley & Sons Inc
 Probability and Statistics for Engineering and th...StatisticsISBN:9781305251809Author:Jay L. DevorePublisher:Cengage Learning
 Statistics for The Behavioral Sciences (MindTap C...StatisticsISBN:9781305504912Author:Frederick J Gravetter, Larry B. WallnauPublisher:Cengage Learning
  Elementary Statistics: Picturing the World (7th E...StatisticsISBN:9780134683416Author:Ron Larson, Betsy FarberPublisher:PEARSON
 The Basic Practice of StatisticsStatisticsISBN:9781319042578Author:David S. Moore, William I. Notz, Michael A. FlignerPublisher:W. H. Freeman
 Introduction to the Practice of StatisticsStatisticsISBN:9781319013387Author:David S. Moore, George P. McCabe, Bruce A. CraigPublisher:W. H. Freeman
MATLAB: An Introduction with Applications
Statistics
ISBN:9781119256830
Author:Amos Gilat
Publisher:John Wiley & Sons Inc
Probability and Statistics for Engineering and th...
Statistics
ISBN:9781305251809
Author:Jay L. Devore
Publisher:Cengage Learning
Statistics for The Behavioral Sciences (MindTap C...
Statistics
ISBN:9781305504912
Author:Frederick J Gravetter, Larry B. Wallnau
Publisher:Cengage Learning
Elementary Statistics: Picturing the World (7th E...
Statistics
ISBN:9780134683416
Author:Ron Larson, Betsy Farber
Publisher:PEARSON
The Basic Practice of Statistics
Statistics
ISBN:9781319042578
Author:David S. Moore, William I. Notz, Michael A. Fligner
Publisher:W. H. Freeman
Introduction to the Practice of Statistics
Statistics
ISBN:9781319013387
Author:David S. Moore, George P. McCabe, Bruce A. Craig
Publisher:W. H. Freeman