MATLAB: An Introduction with Applications
6th Edition
ISBN: 9781119256830
Author: Amos Gilat
Publisher: John Wiley & Sons Inc
expand_more
expand_more
format_list_bulleted
Question

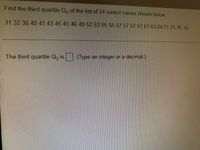
Transcribed Image Text:Find the third quartile Q, of the list of 24 sorted values shown below.
31 32 38 40 41 43 45 45 46 49 52 53 55 55 57 57 57 57 61 63 64 71 75 76 0
The third quartile Q, is
(Type an integer or a decimal.)
Expert Solution
arrow_forward
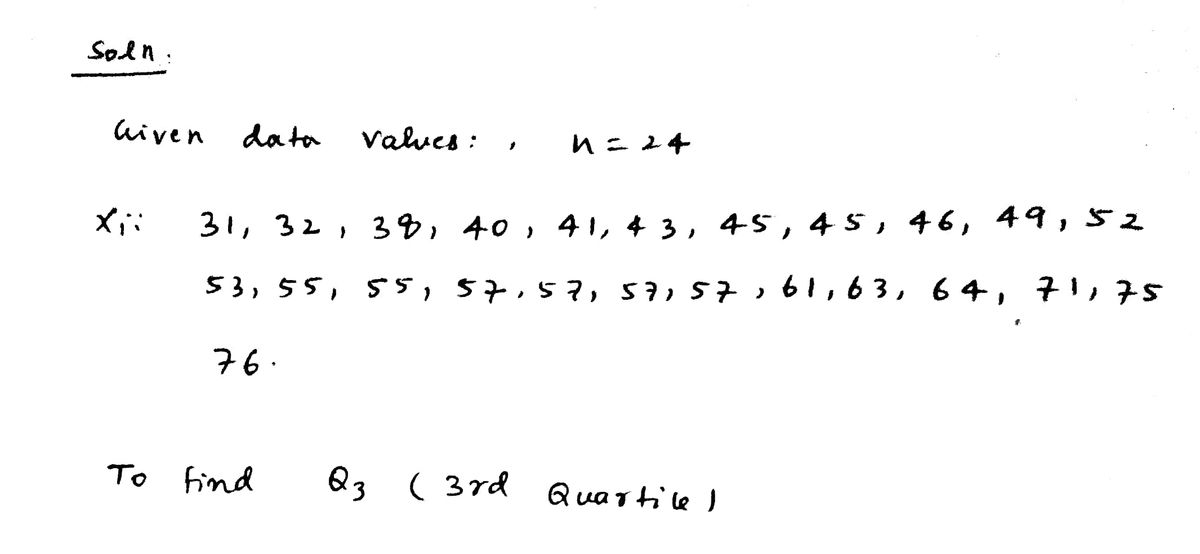
Step 1

Trending nowThis is a popular solution!
Step by stepSolved in 2 steps with 2 images

Knowledge Booster
Similar questions
- Listed below are PSAT scores and SAT scores from prospective college applicants. The scores were reported by participants who responded to a request posted by the website talk.collegeconfidential.com. Does is appear the PSAT scores can predict SAT scores? On what do you base your answer? PSAT 183 207 167 207 197 142 193 176 SAT 2200 2040 1890 2380 2290 2070 2370 1980arrow_forwardThe number of goals for each of a hockey player's seasons is given in the following figure. Find the mean, median, and mode of the number of goals per season for the hockey player. (If more than one mode exists, separate your answers with commas. If an answer does not exist, enter DNE.) mean 45 median mode Season Goals 1979-80 51 1980-81 55 1981-82 92 1982-83 71 1983-84 87 1984-85 73 1985-86 52 1986-87 62 1987-88 43 1988-89 54 Season Goals 1989-90 43 1990-91 41 1991-92 31 1992-93 16 1993-94 38 1994-95 11 1995-96 23 1996-97 25 1997-98 23 1998-99 9arrow_forwardA histogram which is not symmetrically bell-shaped is called shrewed skewed stewed spoofedarrow_forward
- Construct a stem-and-leaf display for the following data. Use a leaf unit of 10. Note: if there is nothing to fill in the box, you should leave it empty. If your answer is "zero" enter "0". 1,369 1,770 1,108 1,691 11 12 13 14 15 16 17 1,344 1,246 1,561 1,121 1000000 0000000 0000000 1,771 1,147 1,120 1,313 1,236 1,728 1,556 1,664arrow_forwardConstruct a stem-and-leaf display for the following data. Use a leaf unit of . Note: if there is nothing to fill in the box, you should leave it empty. If your answer is “zero” enter “0”. 1,543 1,299 1,103 1,557 1,153 1,650 1,190 1,279 1,593 1,416 1,104 1,269 1,665 1,679arrow_forwardFind the five-number summary of the scores in the Math 130 test pre-sented in Table 4.1, page 112. Draw the boxplot.arrow_forward
- A lecturer at college wanted to know if he can predict student’s quiz results by asking them tocomplete a simple survey. The result of the survey is given below: Quiz Results EQR Study Hrs Age Sex BBT MB MC AuHS LM 15 10 3 19 0 0 1 1 0 1 14 15 4 24 0 0 1 0 0 1 9 15 1 20 0 10 1 0 0 1 6 10 3 21 0 0 1 1 0 1 14 15 4 21 0 9 1 0 0 1 12 10 6 21 0 2 0 1 0 1 12 13 2 21 1 8 1 0 0 0 15 15 0 20 0 8 1 0 0 1 12 15 3 20 0 10 1 0 0 1 13 15 0.2 19 0 8 1 0 0 1 15 15 2 20 0 6 1 0 1 1 12 14 5 20 0 5 1 1 1 1 14 15 7 22 0 8 0 0 0 0 7 7 10 21 1 7 0 0 1 0 11 15 5 24 0 0 1 0 0 1 10 10 3 22 1 0 1 0 0 1 13 11 3 23 1 1 1 1 1 1 13 15 2 22 1 8 0 0 0 0 13 12 4 20 1 7 1 0 1 0 13 10 3 20 1 0 1 0 0 1 8 13 5 20 1 8 0 0 0 0 12 13 5 22 0 5 0 0 0 1 13 15 8 22 0 5 0 1 0 1 10 13 4 23 1 7 1 0 0 1 13 13 0.5 20 1 0 0 0 0 0 12 13 0.5 20 1 0 1 0 0 0 15 15 2 21 0 10 1 0 0 1 10 13 6 22 0 6 1 1 0 1 11 8 5 20 0 10 0 0 1 0 12 10 4 19 1 0 1 0 0 1 8 5 2 20 1 0 1 0 1 0 11…arrow_forwardPlease help with these three parts. ? Thank you!arrow_forward
arrow_back_ios
arrow_forward_ios
Recommended textbooks for you
 MATLAB: An Introduction with ApplicationsStatisticsISBN:9781119256830Author:Amos GilatPublisher:John Wiley & Sons Inc
 Probability and Statistics for Engineering and th...StatisticsISBN:9781305251809Author:Jay L. DevorePublisher:Cengage Learning
 Statistics for The Behavioral Sciences (MindTap C...StatisticsISBN:9781305504912Author:Frederick J Gravetter, Larry B. WallnauPublisher:Cengage Learning
 Elementary Statistics: Picturing the World (7th E...StatisticsISBN:9780134683416Author:Ron Larson, Betsy FarberPublisher:PEARSON
 The Basic Practice of StatisticsStatisticsISBN:9781319042578Author:David S. Moore, William I. Notz, Michael A. FlignerPublisher:W. H. Freeman
 Introduction to the Practice of StatisticsStatisticsISBN:9781319013387Author:David S. Moore, George P. McCabe, Bruce A. CraigPublisher:W. H. Freeman

MATLAB: An Introduction with Applications
Statistics
ISBN:9781119256830
Author:Amos Gilat
Publisher:John Wiley & Sons Inc

Probability and Statistics for Engineering and th...
Statistics
ISBN:9781305251809
Author:Jay L. Devore
Publisher:Cengage Learning

Statistics for The Behavioral Sciences (MindTap C...
Statistics
ISBN:9781305504912
Author:Frederick J Gravetter, Larry B. Wallnau
Publisher:Cengage Learning

Elementary Statistics: Picturing the World (7th E...
Statistics
ISBN:9780134683416
Author:Ron Larson, Betsy Farber
Publisher:PEARSON

The Basic Practice of Statistics
Statistics
ISBN:9781319042578
Author:David S. Moore, William I. Notz, Michael A. Fligner
Publisher:W. H. Freeman

Introduction to the Practice of Statistics
Statistics
ISBN:9781319013387
Author:David S. Moore, George P. McCabe, Bruce A. Craig
Publisher:W. H. Freeman