MATLAB: An Introduction with Applications
6th Edition
ISBN: 9781119256830
Author: Amos Gilat
Publisher: John Wiley & Sons Inc
expand_more
expand_more
format_list_bulleted
Question

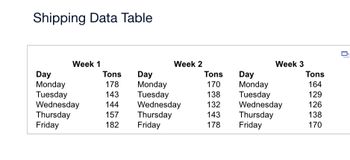
Transcribed Image Text:Shipping Data Table
Week 1
Day
Monday
Tuesday
Wednesday
Thursday
Friday
Tons
178
143
144
157
182
Week 2
Day
Monday
Tuesday
Wednesday
Thursday
Friday
Tons
170
138
132
143
178
Day
Monday
Tuesday
Week 3
Wednesday
Thursday
Friday
Tons
164
129
126
138
170
0

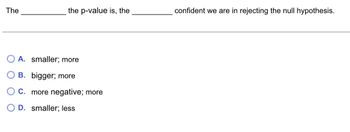
Transcribed Image Text:The
the p-value is, the
A. smaller; more
B. bigger; more
C. more negative; more
D. smaller; less
confident we are in rejecting the null hypothesis.
Expert Solution
This question has been solved!
Explore an expertly crafted, step-by-step solution for a thorough understanding of key concepts.
Step by stepSolved in 3 steps

Knowledge Booster
Similar questions
- In the recent census, three percent of the U.S. population reported being two or more races. However, the percent varies tremendously from state to state. Suppose 2 random surveys are conducted. In the first random survey, out of 1,000 north dakotans, 9 people reported being of two or more races. In a second random survey, out of 500 nevadans, 17 people reported being of 2 or more races. Conduct a hypothesis test to determine if the proportions are the same for the two states or if the proportion for Nevada is statistically different than that of north Dakota.arrow_forwardA decade-old study found that the proportion of high school seniors who felt that "getting rich" was an important personal goal was 72%. Suppose that we have reason to believe that this proportion has changed, and we wish to carry out a hypothesis test to see if our belief can be supported. O State the null hypothesis H, and the alternative hypothesis H, that we would use for this test. Ho: 0 H: 0 O0 O20 O=0 ?arrow_forwardman loves, as everyone should, to collect and analyze statistical information. He wishes to find a relationship between how many hours students study and how they do on their statistics tests. He takes a random sample of 16 students at Ideal U., asks how many hours they studied for a university-wide stat test and how they did on the test, enters the data into a computer for analysis and presents the results below. ANALYSIS OF HOURS AND GRADES (n = 16): Descriptive Statistics: HOURS GRADES Mean: 4.2 75.8 Mode: 5.0 79.0 St. Dev: 2.3 10.1 Quartiles: Q0 2.0 34.0 Q1 3.2 53.7 Q2 4.7 78.5 Q3 6.3 86.9 Q4 9.0 97.0 Regression Analysis: Reg. Eq. is: GRADE = 16.9 + 9.025*HOURS Rsquared = .985 std error = 0.027 F = 8.52 p = .018 We know that 25% of all the grades falls into which of these regions? a. 78.5 to 79.0 b. 78.5 to 86.9 c. 75.8 to 86.9 d. 75.8 to 97.0 e. 78.5 to 97.0 f. 75.8 to 79.0arrow_forward
- Suppose a researcher compares the means of two independent groups that have the same number of participants in each group. The researcher uses the .05 level of significance and obtains a calculated value of t of 2.11. At least how many participants must be in each group in order to reject the null hypothesis?A. 10B. 9C. 8D. 11arrow_forwardThe following table contains the number of successes and failures for three categories of a variable. Test whether the proportions are equal for each category at the α=0.1 level of significance. Category 1 Category 2 Category 3 Failures 32 51 57 Successes 39 54 73 State the hypotheses. Choose the correct answer below. A. H0: The categories of the variable and success and failure are independent. H1: The categories of the variable and success and failure are dependent. B. H0: The categories of the variable and success and failure are dependent. H1: The categories of the variable and success and failure are independent. C. H0: p1=p2=p3 H1: At least one of the proportions is different from the others. D. H0: μ1=E1 and μ2=E2 and μ3=E3 H1: At least one mean is different from what is expected. What is the P-value? nothing (Round to three decimal places as needed.) What conclusion can be…arrow_forwardDecide if each of the following statements is True or False. If a sample of n = 10 scores is transformed into z-scores, there will be five positive z-scores and five negative z-scores. True Falsearrow_forward
- A humane society claims that less than 61% of households in a certain country own a pet. In a random sample of 700 households in that country, 399 say they own a pet. At a= 0.05, is there enough evidence to support the society's claim? Complete parts (a) through (c) below. (a) Identify the claim and state H, and Ha. Identify the claim in this scenario. Select the correct choice below and fill in the answer box to complete your choice. (Type an integer or a decimal. Do not round.) O A. The percentage households in the country' that own a pet is not %. O B. Less than % of households in the country own a pet. O C. More than % of households in the country own a pet. O D. % of hoúseholds in the country own a pet.arrow_forwardIt is clairmeu that the proportion of high school students in the United States who use computers for educational purposes is at most 72%. Suppose that we have reason to believe otherwise and wish to carry out a hypothesis test for this claim. State the null hypothesis H, and the alternative hypothesis H, that we would use for this test. H, :0 H, :0 Oarrow_forwardExpress the null hypothesis and the alternative hypothesis in symbolic form. Use the correct symbol (μ, ρ, σ) for the indicated parameter. A psychologist claims that more than 5.8 percent of the population suffers from professional problems due to extreme shyness. Use p, the true percentage of the population that suffers from extreme shyness. Group of answer choices H0 : p = 5.8%H1 : p ≤ 5.8% H0 : p = 5.8%H1 : p < 5.8% H0 : p = 5.8%H1 : p > 5.8% H0 : p = 5.8%H1 : p ≥ 5.8%arrow_forward
- 20. Which of the following is a null hypothesis? a. Pregnant women who drink cranberry juice will have lower urine bacterial counts than those who do not drink cranberry juice. b. The urine bacterial count of pregnant women who drink cranberry juice will be lower or equal to that of pregnant women who do not drink the juice. c. There will be a difference between ingestion of cranberry juice and among pregnant women who do and do not have high urine bacterial counts.arrow_forwardA psychologist found a study which claiming that 32% of patients who visit a psychologist have symptoms of anxiety. This psychologist had 44 patients visit. Let x = the number of patients that had symptoms of anxiety. (a) The random variable is which of the following? O the number of psychologists O the number of patients who visited the psychologist the number of patients who had symptoms of anxiety O the number of patients without symptoms of anxiety (b) How many total patients did the psychologist have visit?arrow_forwardThe smaller the value of your Z obtained: a. The more probable that you will be able to reject the null hypothesis b. The more probable that you will fail to reject the null hypothesis c. The smaller your probability of making a Type II error d. The smaller your probability of making a Type I errorarrow_forward
arrow_back_ios
SEE MORE QUESTIONS
arrow_forward_ios
Recommended textbooks for you
 MATLAB: An Introduction with ApplicationsStatisticsISBN:9781119256830Author:Amos GilatPublisher:John Wiley & Sons Inc
 Probability and Statistics for Engineering and th...StatisticsISBN:9781305251809Author:Jay L. DevorePublisher:Cengage Learning
 Statistics for The Behavioral Sciences (MindTap C...StatisticsISBN:9781305504912Author:Frederick J Gravetter, Larry B. WallnauPublisher:Cengage Learning
 Elementary Statistics: Picturing the World (7th E...StatisticsISBN:9780134683416Author:Ron Larson, Betsy FarberPublisher:PEARSON
 The Basic Practice of StatisticsStatisticsISBN:9781319042578Author:David S. Moore, William I. Notz, Michael A. FlignerPublisher:W. H. Freeman
 Introduction to the Practice of StatisticsStatisticsISBN:9781319013387Author:David S. Moore, George P. McCabe, Bruce A. CraigPublisher:W. H. Freeman

MATLAB: An Introduction with Applications
Statistics
ISBN:9781119256830
Author:Amos Gilat
Publisher:John Wiley & Sons Inc

Probability and Statistics for Engineering and th...
Statistics
ISBN:9781305251809
Author:Jay L. Devore
Publisher:Cengage Learning

Statistics for The Behavioral Sciences (MindTap C...
Statistics
ISBN:9781305504912
Author:Frederick J Gravetter, Larry B. Wallnau
Publisher:Cengage Learning

Elementary Statistics: Picturing the World (7th E...
Statistics
ISBN:9780134683416
Author:Ron Larson, Betsy Farber
Publisher:PEARSON

The Basic Practice of Statistics
Statistics
ISBN:9781319042578
Author:David S. Moore, William I. Notz, Michael A. Fligner
Publisher:W. H. Freeman

Introduction to the Practice of Statistics
Statistics
ISBN:9781319013387
Author:David S. Moore, George P. McCabe, Bruce A. Craig
Publisher:W. H. Freeman