Advanced Engineering Mathematics
10th Edition
ISBN: 9780470458365
Author: Erwin Kreyszig
Publisher: Wiley, John & Sons, Incorporated
expand_more
expand_more
format_list_bulleted
Question

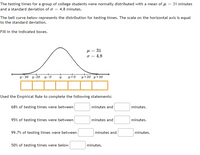
Transcribed Image Text:The testing times for a group of college students were normally distributed with a mean of u :
31 minutes
and a standard deviation of o = 4.8 minutes.
The bell curve below represents the distribution for testing times. The scale on the horizontal axis is equal
to the standard deviation.
Fill in the indicated boxes.
H = 31
4.8
O =
H-30 u-20 u - o
μ+ 20 μ+3σ
Used the Empirical Rule to complete the following statements:
68% of testing times were between
minutes and
minutes.
95% of testing times were between
minutes and
utes.
99.7% of testing times were between
minutes and
minutes.
50% of testing times were below
minutes.
Expert Solution
This question has been solved!
Explore an expertly crafted, step-by-step solution for a thorough understanding of key concepts.
This is a popular solution
Trending nowThis is a popular solution!
Step by stepSolved in 2 steps

Knowledge Booster
Learn more about
Need a deep-dive on the concept behind this application? Look no further. Learn more about this topic, advanced-math and related others by exploring similar questions and additional content below.Similar questions
- Convert the following equation to subscript notation and identify the Dependent, Independent Variable, the order, degree, linearity and type of the DE. Show your solution if necessary. 2 Txx + (Tyy)? + Tz = 0 XXarrow_forwardRefer to the following normal curve, with mean µ and standard deviation o. The standard deviation o= Select one: a. 6 b. 24 3 d. 12 C. e. none of these 16% of total area 44 56 16% of total areaarrow_forwardFind the areas for the following z values. Use standard normal table. Provide your answers to four decimal places (4 dp.) Area to the left of z=0.00 - Area to the left of z=2.33 - Using your calculator in STAT MODE, find the mean and standard deviation of the following sample for the variable age (Round to 3 dp). 18 18 20 20 23 25 29 35 Mean : Standard Deviation :arrow_forward
- You are given that X follows a Weibull distribution where alpha = 2.3 beta = 17.4 What is the value of the the 60th percentile of this distribution?arrow_forwardstep by step pleasearrow_forwardThe time to complete an exam is approximately Normal with a mean μ = 47 minutes and a standard deviation o = 8 minutes. The bell curve below represents the distribution for testing times. The scale on the horizontal axis is equal to the standard deviation. 1. Fill in the indicated boxes. μ-3σ μ-2ο μίσ + μ μ+o 47 minutes. 2. Used the Empirical Rule to complete the following statements: 95% of testing times were between and μ = 47 σ = 8 μ+20 μ+30 minutes and 55 minutes. minutes % of the testing times were between 39arrow_forward
- Our environment is very sensitive to the amount of ozone in the upper atmosphere. The level of ozone normally found is 7.5 parts/million (ppm). A researcher believes that the current ozone level is at an excess level. The mean of 66 samples is 7.7 ppm with a standard deviation of 1.0 Does the data support the claim at the 0.025 level? Assume the population distribution is approximately normal. Step 2 of 5 : Find the value of the test statistic. Round your answer to three decimal places. Specify if the test is one-tailed or two-tailed. Determine the decision rule for rejecting the null hypothesis. Round your answer to three decimal places. Make the decision to reject or fail to reject the null hypothesis.arrow_forwardIf you chose the α level of .01, then which of the following p value will allow you to conclude that your result is statistically significant? a. 0.005 b. 0.05 c. 0.10 d. 0.03arrow_forwardA population data set with a normal distribution has a mean u = 4 and a standard deviation o = 1.1. Find the approximate proportion of observations in the data set that lie below 5.1? O 0.84 0.17 O 0.34 0.68arrow_forward
- The data given below are the weights for a sample of babies. Assume the population of birth weights is normally distributed with a mean of μ= 7.10 DATA: 6.88 6.00 8.19 7.44 7.06 5.06 8.38 7.44 8.31 6.38 What is the mean weight in our sample? What is the standard deviation of our sample? What is the z-score for the heaviest baby in the sample? Give both the X-value and the z-score. What is the z-score for the lightest baby in the sample? Give both the X-value and the z-score. Assuming the distribution of birth weights is normally distributed, what percent of the babies in this distribution weigh more than our heaviest baby?arrow_forwardFor a population with mean 90 and standard deviation 10 A. find the percentile rank for a score of 95 B. Find the cutoff score (for the population with mean 90, not the z score) for top 2% C. Find the cutoff score (for the population with mean 90, not the z score) for the lowest 20 %arrow_forward
arrow_back_ios
arrow_forward_ios
Recommended textbooks for you
 Advanced Engineering MathematicsAdvanced MathISBN:9780470458365Author:Erwin KreyszigPublisher:Wiley, John & Sons, Incorporated
 Numerical Methods for EngineersAdvanced MathISBN:9780073397924Author:Steven C. Chapra Dr., Raymond P. CanalePublisher:McGraw-Hill Education
 Introductory Mathematics for Engineering Applicat...Advanced MathISBN:9781118141809Author:Nathan KlingbeilPublisher:WILEY
 Mathematics For Machine TechnologyAdvanced MathISBN:9781337798310Author:Peterson, John.Publisher:Cengage Learning,


Advanced Engineering Mathematics
Advanced Math
ISBN:9780470458365
Author:Erwin Kreyszig
Publisher:Wiley, John & Sons, Incorporated

Numerical Methods for Engineers
Advanced Math
ISBN:9780073397924
Author:Steven C. Chapra Dr., Raymond P. Canale
Publisher:McGraw-Hill Education

Introductory Mathematics for Engineering Applicat...
Advanced Math
ISBN:9781118141809
Author:Nathan Klingbeil
Publisher:WILEY

Mathematics For Machine Technology
Advanced Math
ISBN:9781337798310
Author:Peterson, John.
Publisher:Cengage Learning,

