
MATLAB: An Introduction with Applications
6th Edition
ISBN: 9781119256830
Author: Amos Gilat
Publisher: John Wiley & Sons Inc
expand_more
expand_more
format_list_bulleted
Related questions
Question
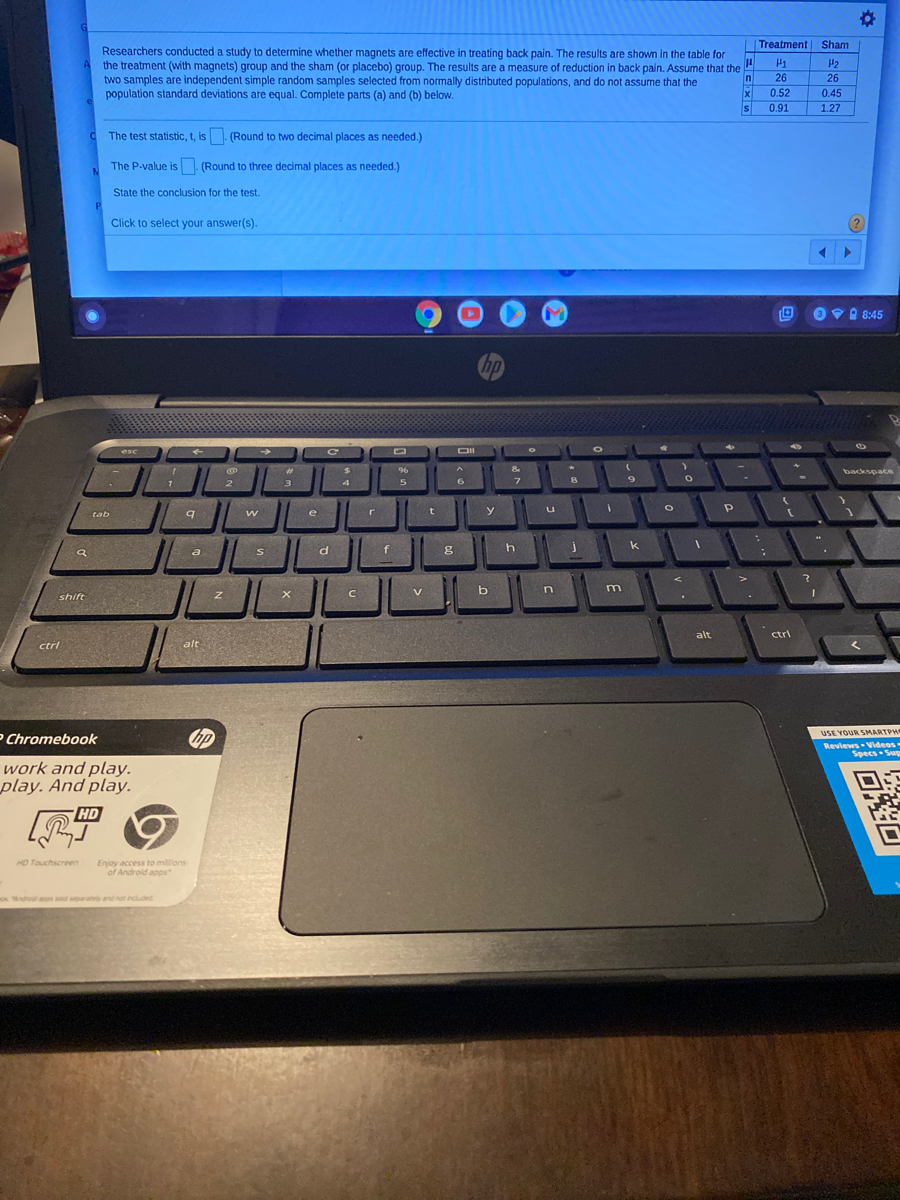

Transcribed Image Text:Treatment
Sham
Researchers conducted a study to determine whether magnets are effective in treating back pain. The results are shown in the table for
the treatment (with magnets) group and the sham (or placebo) group. The results are a measure of reduction in back pain. Assume that the
two samples are independent simple random samples selected from normally distributed populations, and do not assume that the
population standard deviations are equal. Complete parts (a) and (b) below.
P1
H2
26
26
0.52
0.45
0.91
1.27
The test statistic, t, is. (Round to two decimal places as needed.)
The P-value is (Round to three decimal places as needed.)
State the conclusion for the test.
Click to select your answer(s).
(?
OV0 8:45
Chp
esc
OII
%23
%24
96
&
backspace
2
3
4
6
7.
t
y
P
tab
e
k
a
f
g
m
shift
alt
ctri
ctrl
alt
PChromebook
の
USE YOUR SMARTPH
Reviews Videes
Specs Su
work and play.
play. And play.
HD
HO Touchscreen
Enjoy access to millons
of Android apps
s s arty and net included
Expert Solution
This question has been solved!
Explore an expertly crafted, step-by-step solution for a thorough understanding of key concepts.

Step by stepSolved in 3 steps

Knowledge Booster


Learn more about
Need a deep-dive on the concept behind this application? Look no further. Learn more about this topic, statistics and related others by exploring similar questions and additional content below.Similar questions
- Chantelle’s score on an IQ test, expressed as a z score, is 0. What was her score? (M = 100, s = 15)arrow_forwardSolve using R calculator. Show all work.arrow_forwardWithout measuring, pick the best choice by estimating. If the doctor says that your child's temperature is 35°C, your child's temperature is which of the following? low normal higharrow_forward
- q16arrow_forwardThomas scored at the 45th percentile on the midterm. Which interpretation of his score is the best? Group of answer choices 45% of the people tested exceeded his score. Thomas had a better score than 45% of the people tested. Thomas got 45% of the items correct. More than one of the above is appropriate.arrow_forwardFind the value of the test statistic. T* = 51.50 Find the p-value. (Round your answer to four decimal places.) p-value = 0.0071 Xarrow_forward
- Since 1994, the Best Roller Coaster Poll has been ranking the world's roller coasters. In 2013, Bizarro dropped to 4th after eaming the top steel coaster rank for six straight years. Data on 11 of the top steel coasters from this poll are presented in the accompanying lable What do these data indicate about the Length of the track and the Duration of the ride you can expect? E Click the icon to view the steel coaster data. Construct a scatterplot of the data. Choose the correct plot below. A. OB. O D. Q 240 240 240- 240 40 2000 6000 Length (A) 40 2000 6000 2 40 2000 6000 (2 Length () 40 2000 Length () 6000 ( Length (n) Find the correlation coefficient. Steel coaster data (Round to three decimal places as Маx Max Vert Duration Height Speed (sec) Length (ft) Initial Angle Rank Roller Coaster (mph) (degrees) Park 1 Expedition GeForce Holiday Park Six Flags Kings Dominion SF New England Hersheypark Cedar Point PortAventua Six Flags Mirabilandia Location Drop (ft) (ft) DE 184 75 188 74.6 82…arrow_forwardFind x rounded to one decimal place. X = |12 %D 30 6arrow_forward=CONFIDENCE.T (0.1, 3.533, 16arrow_forward
arrow_back_ios
arrow_forward_ios
Recommended textbooks for you
- MATLAB: An Introduction with ApplicationsStatisticsISBN:9781119256830Author:Amos GilatPublisher:John Wiley & Sons Inc
 Probability and Statistics for Engineering and th...StatisticsISBN:9781305251809Author:Jay L. DevorePublisher:Cengage Learning
 Statistics for The Behavioral Sciences (MindTap C...StatisticsISBN:9781305504912Author:Frederick J Gravetter, Larry B. WallnauPublisher:Cengage Learning
  Elementary Statistics: Picturing the World (7th E...StatisticsISBN:9780134683416Author:Ron Larson, Betsy FarberPublisher:PEARSON
 The Basic Practice of StatisticsStatisticsISBN:9781319042578Author:David S. Moore, William I. Notz, Michael A. FlignerPublisher:W. H. Freeman
 Introduction to the Practice of StatisticsStatisticsISBN:9781319013387Author:David S. Moore, George P. McCabe, Bruce A. CraigPublisher:W. H. Freeman
MATLAB: An Introduction with Applications
Statistics
ISBN:9781119256830
Author:Amos Gilat
Publisher:John Wiley & Sons Inc
Probability and Statistics for Engineering and th...
Statistics
ISBN:9781305251809
Author:Jay L. Devore
Publisher:Cengage Learning
Statistics for The Behavioral Sciences (MindTap C...
Statistics
ISBN:9781305504912
Author:Frederick J Gravetter, Larry B. Wallnau
Publisher:Cengage Learning
Elementary Statistics: Picturing the World (7th E...
Statistics
ISBN:9780134683416
Author:Ron Larson, Betsy Farber
Publisher:PEARSON
The Basic Practice of Statistics
Statistics
ISBN:9781319042578
Author:David S. Moore, William I. Notz, Michael A. Fligner
Publisher:W. H. Freeman
Introduction to the Practice of Statistics
Statistics
ISBN:9781319013387
Author:David S. Moore, George P. McCabe, Bruce A. Craig
Publisher:W. H. Freeman