
MATLAB: An Introduction with Applications
6th Edition
ISBN: 9781119256830
Author: Amos Gilat
Publisher: John Wiley & Sons Inc
expand_more
expand_more
format_list_bulleted
Related questions
Question
t8
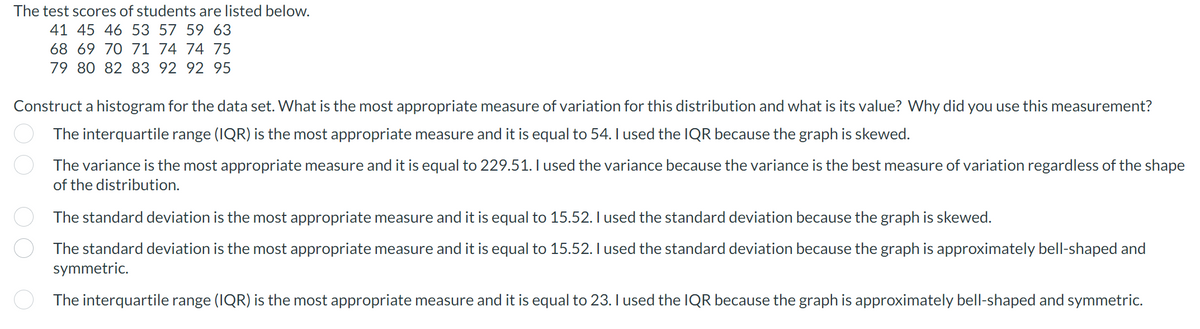

Transcribed Image Text:The test scores of students are listed below.
41 45 46 53 57 59 63
68 69 70 71 74 74 75
79 80 82 83 92 92 95
Construct a histogram for the data set. What is the most appropriate measure of variation for this distribution and what is its value? Why did you use this measurement?
The interquartile range (IQR) is the most appropriate measure and it is equal to 54. I used the IQR because the graph is skewed.
O O
The variance is the most appropriate measure and it is equal to 229.51. I used the variance because the variance is the best measure of variation regardless of the shape
of the distribution.
The standard deviation is the most appropriate measure and it is equal to 15.52. I used the standard deviation because the graph is skewed.
The standard deviation is the most appropriate measure and it is equal to 15.52. I used the standard deviation because the graph is approximately bell-shaped and
symmetric.
The interquartile range (IQR) is the most appropriate measure and it is equal to 23. I used the IQR because the graph is approximately bell-shaped and symmetric.
Expert Solution
arrow_forward
Step 1
Given data:
41 45 46 53 57 59 63
68 69 70 71 74 74 75
79 80 82 83 92 92 95

Trending nowThis is a popular solution!

Step by stepSolved in 3 steps with 1 images

Knowledge Booster

Similar questions
Recommended textbooks for you
- MATLAB: An Introduction with ApplicationsStatisticsISBN:9781119256830Author:Amos GilatPublisher:John Wiley & Sons Inc
 Probability and Statistics for Engineering and th...StatisticsISBN:9781305251809Author:Jay L. DevorePublisher:Cengage Learning
 Statistics for The Behavioral Sciences (MindTap C...StatisticsISBN:9781305504912Author:Frederick J Gravetter, Larry B. WallnauPublisher:Cengage Learning
  Elementary Statistics: Picturing the World (7th E...StatisticsISBN:9780134683416Author:Ron Larson, Betsy FarberPublisher:PEARSON
 The Basic Practice of StatisticsStatisticsISBN:9781319042578Author:David S. Moore, William I. Notz, Michael A. FlignerPublisher:W. H. Freeman
 Introduction to the Practice of StatisticsStatisticsISBN:9781319013387Author:David S. Moore, George P. McCabe, Bruce A. CraigPublisher:W. H. Freeman
MATLAB: An Introduction with Applications
Statistics
ISBN:9781119256830
Author:Amos Gilat
Publisher:John Wiley & Sons Inc
Probability and Statistics for Engineering and th...
Statistics
ISBN:9781305251809
Author:Jay L. Devore
Publisher:Cengage Learning
Statistics for The Behavioral Sciences (MindTap C...
Statistics
ISBN:9781305504912
Author:Frederick J Gravetter, Larry B. Wallnau
Publisher:Cengage Learning
Elementary Statistics: Picturing the World (7th E...
Statistics
ISBN:9780134683416
Author:Ron Larson, Betsy Farber
Publisher:PEARSON
The Basic Practice of Statistics
Statistics
ISBN:9781319042578
Author:David S. Moore, William I. Notz, Michael A. Fligner
Publisher:W. H. Freeman
Introduction to the Practice of Statistics
Statistics
ISBN:9781319013387
Author:David S. Moore, George P. McCabe, Bruce A. Craig
Publisher:W. H. Freeman