MATLAB: An Introduction with Applications
6th Edition
ISBN: 9781119256830
Author: Amos Gilat
Publisher: John Wiley & Sons Inc
expand_more
expand_more
format_list_bulleted
Topic Video
Question

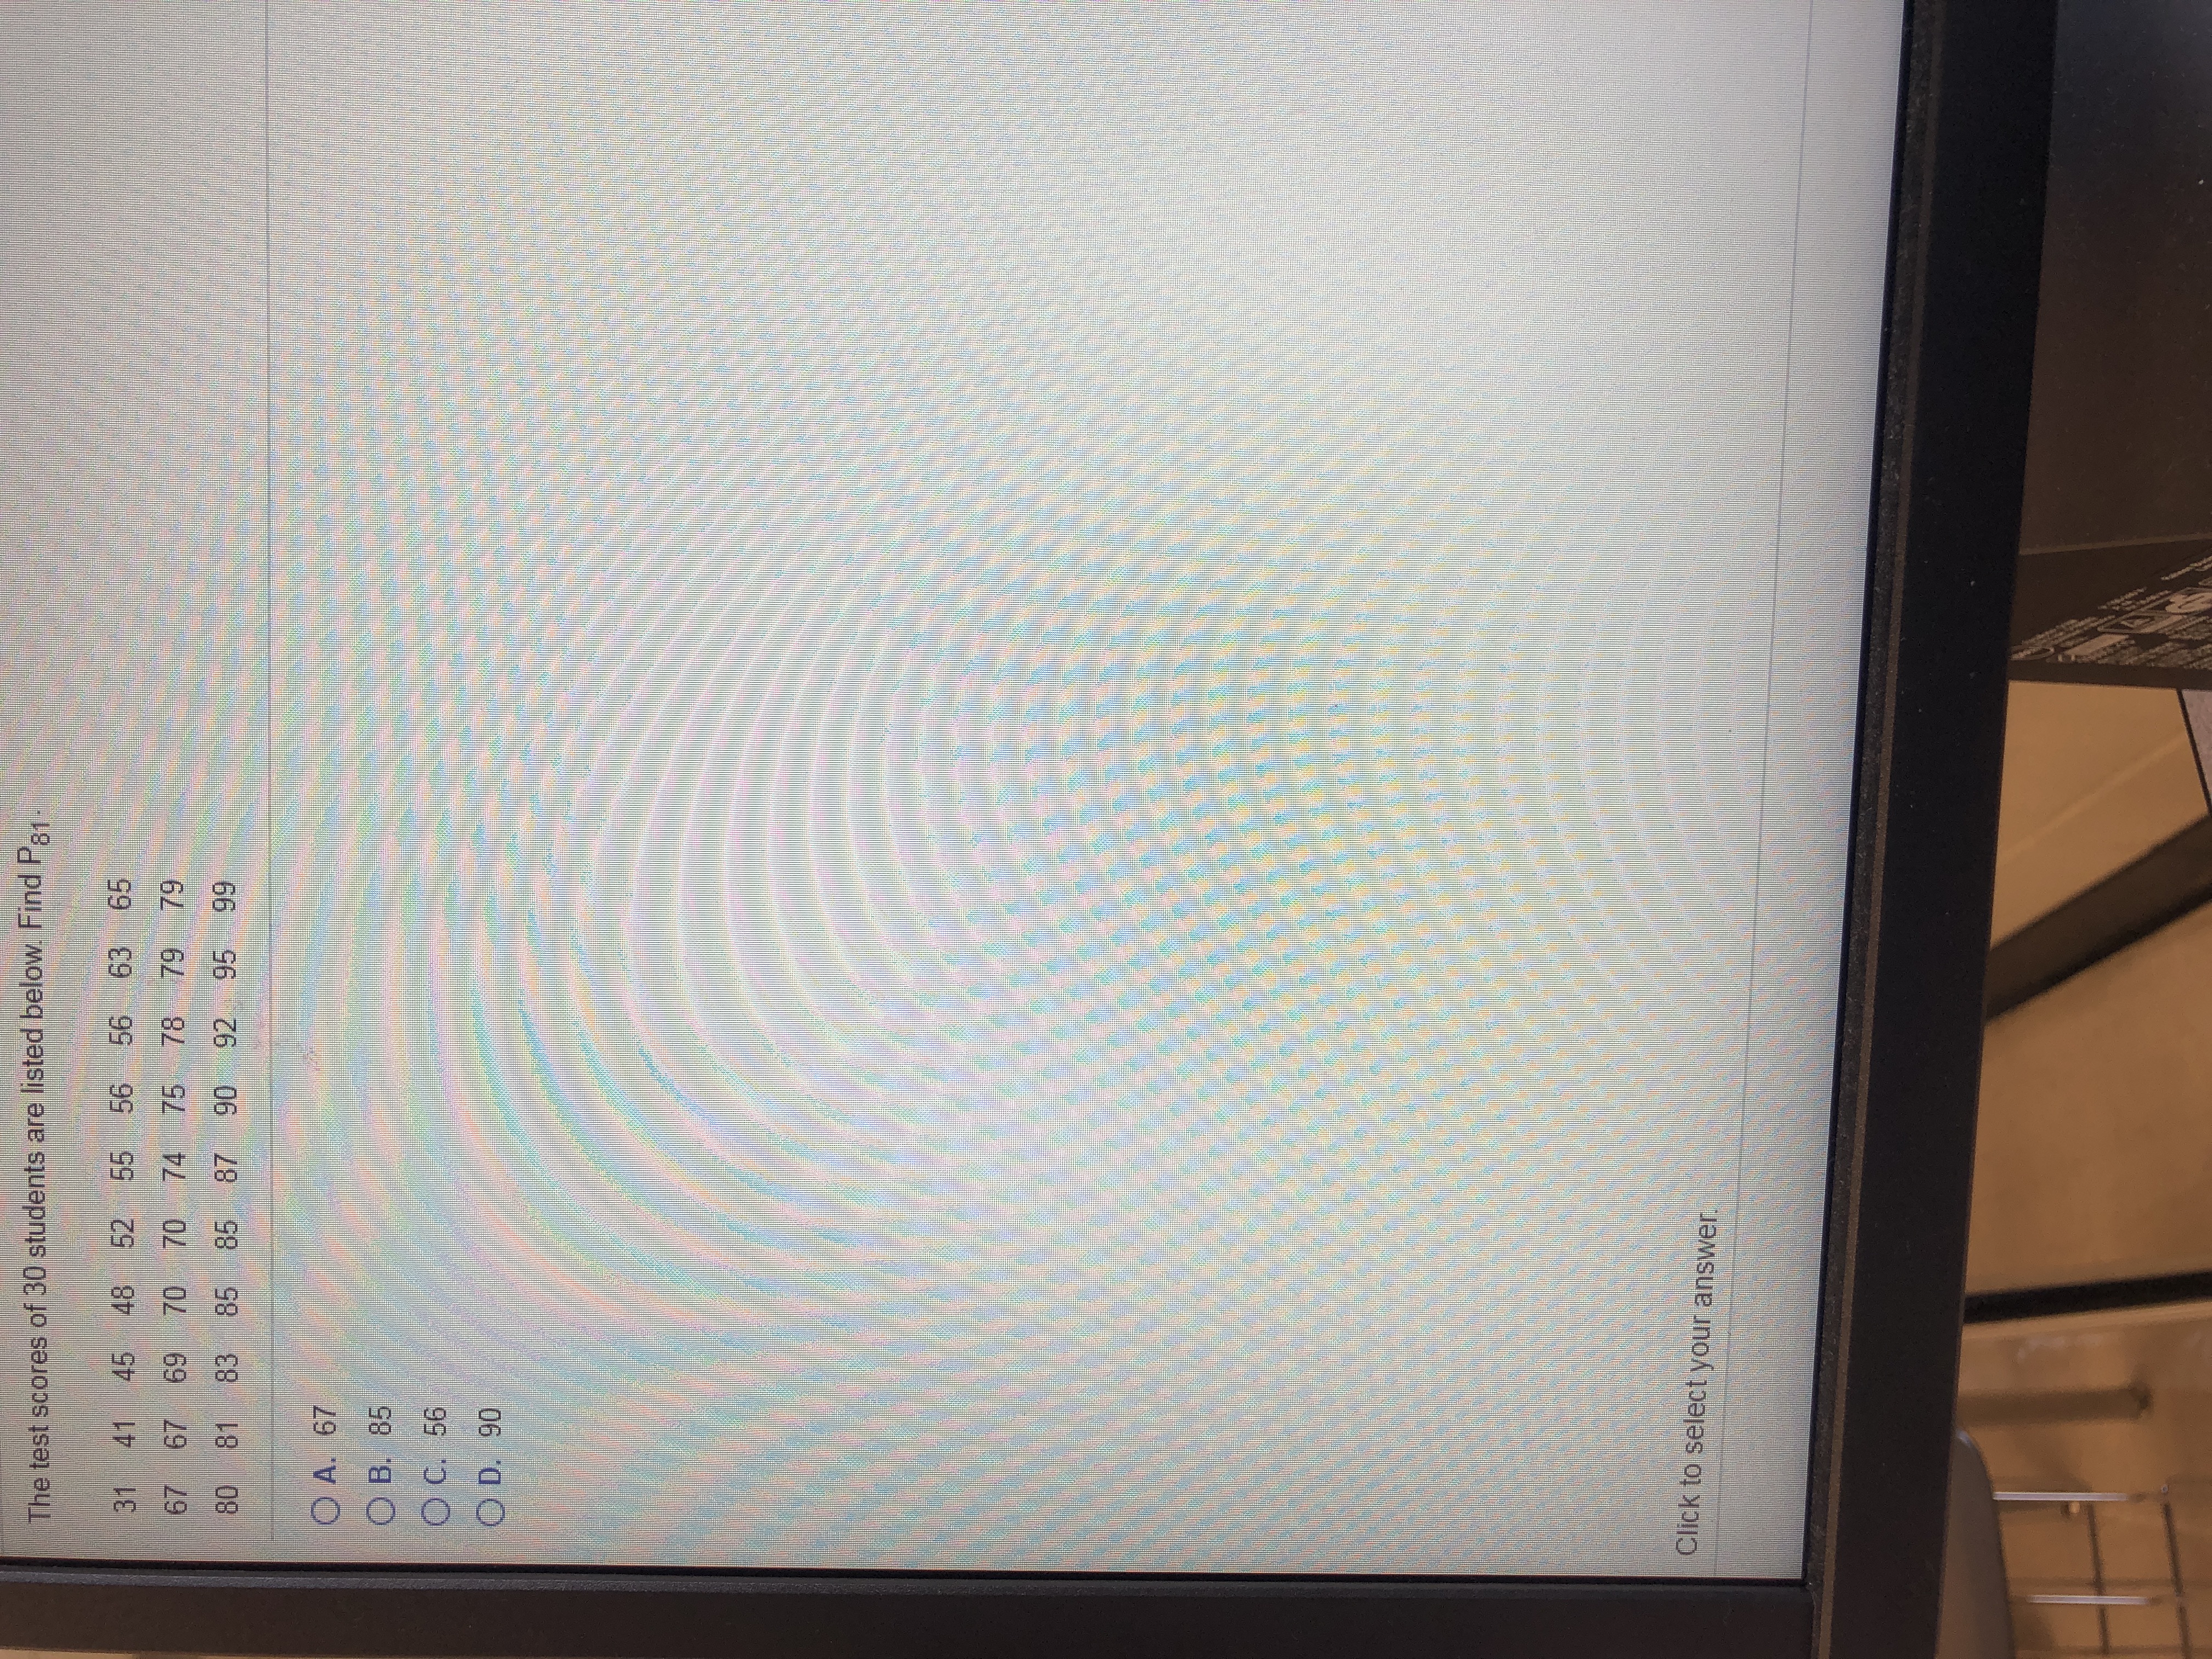
Transcribed Image Text:The test scores of 30 students are listed below. Find P81
31 41
45
48
52
55 56
56 63
65
67 67
69
70 70 74
75 78 79
79
80
81
83 85
85
87 90
92 95
99
O A. 67
O B. 85
ОС. 56
O D. 90
Expert Solution
This question has been solved!
Explore an expertly crafted, step-by-step solution for a thorough understanding of key concepts.
This is a popular solution
Trending nowThis is a popular solution!
Step by stepSolved in 2 steps with 1 images

Knowledge Booster
Learn more about
Need a deep-dive on the concept behind this application? Look no further. Learn more about this topic, statistics and related others by exploring similar questions and additional content below.Similar questions
- 9 pleasearrow_forwardDr. A. Ventura is interested in determining what kinds and how many pets people own in Bakersfield. He stands outside Petco and asks people what kind of pet they own. This is the result of his survey: dog=1; cat=2; bird=3; reptile=4; fish=5; other=6 1,1,2,2,2,1,1,3,2,3,1,1,1,2,2,4,4,2,2,1,1,1,5,4,3,4,1,1,1,2,2,6,1,1,2,2,1,2,1,2,6,3,4,5arrow_forwardFind the indicated measure.The test scores of 21 students are listed below. Find Q3. 56 57 59 63 65 66 69 70 71 74 75 77 78 79 80 82 83 86 92 95 99 82.5 69.5 24 75arrow_forward
- How long does it take to finish the 1161-mile Iditarod Dog Sled Race from Anchorage to Nome, Alaska? Finish times (to the nearest hour) for 57 dogsled teams are shown below. 261 271 236 244 279 296 284 299 288 288 247 256 338 360 341 333 261 266 287 296 313 311 307 307 299 303 277 283 304 305 288 290 288 289 297 299 332 330 309 328 307 328 285 291 295 298 306 315 310 318 318 320 333 321 323 324 327 USE SALT For this problem, use five classes. (a) Find the class width. 25 236 261 286 311 336 (b) Make a frequency table showing class limits, class boundaries, midpoints, frequencies, relative frequencies, and cumulative frequencies. (Round your relative frequencies to two decimal places.) Class Limits Class Boundaries Midpoint Frequency I I I - 260 285 310 335 360 - Relative Cumulative Frequency Frequencyarrow_forwardHere are seven ages of college students (in years): 30, 18, 44, 21, 22, 25, and 26. Find their median. a.) 25.00 b.) 26.57 c.) 8.60arrow_forwardFind P54 from the following data 9 19 21 29 34 37 42 46 48 49 53 58 62 63 65 66 68 69 70 73 81 82 83 87 92 P54 =arrow_forward
- How long does it take to finish the 1161-mile Iditarod Dog Sled Race from Anchorage to Nome, Alaska? Finish times (to the nearest hour) for 57 dogsled teams are shown below. 261 271 236 244 279 296 284 299 288 288 247 256 338 360 341 333 261 266 287 296 313 311 307 307 299 303 277 283 304 305 288 290 288 289 297 299 332 330 309 328 307 328 285 291 295 298 306 315 310 318 318 320 333 321 323 324 327 For this problem, use five classes. (a) Find the class width. (b) Make a frequency table showing class limits, class boundaries, midpoints, frequencies, relative frequencies, and cumulative frequencies. (Give relative frequencies to 2 decimal places.)arrow_forwardThe table below represents a sa distribution. 77 89 82 89 72 78 55 102 86 94 89 89 64 71 84 75 64 68 98 95arrow_forwardI only need Part D.arrow_forward
- Consider the following 10 exam scores: 28, 57, 58, 64, 69, 74, 79, 80, 83, and 85 what is the mode?arrow_forwardThe mean of 5 numbers is 20. If one number is excluded their mean is 15. Then the excluded number is O a. 20 Ob. O b. 40 О с. 5 O d. 10arrow_forwardFind P39 from the following data 5 10 11 16 23 27 33 35 37 42 44 46 50 53 54 55 68 69 73 74 76 77 79 81 86 93 95 100 P39 =arrow_forward
arrow_back_ios
arrow_forward_ios
Recommended textbooks for you
 MATLAB: An Introduction with ApplicationsStatisticsISBN:9781119256830Author:Amos GilatPublisher:John Wiley & Sons Inc
 Probability and Statistics for Engineering and th...StatisticsISBN:9781305251809Author:Jay L. DevorePublisher:Cengage Learning
 Statistics for The Behavioral Sciences (MindTap C...StatisticsISBN:9781305504912Author:Frederick J Gravetter, Larry B. WallnauPublisher:Cengage Learning
 Elementary Statistics: Picturing the World (7th E...StatisticsISBN:9780134683416Author:Ron Larson, Betsy FarberPublisher:PEARSON
 The Basic Practice of StatisticsStatisticsISBN:9781319042578Author:David S. Moore, William I. Notz, Michael A. FlignerPublisher:W. H. Freeman
 Introduction to the Practice of StatisticsStatisticsISBN:9781319013387Author:David S. Moore, George P. McCabe, Bruce A. CraigPublisher:W. H. Freeman

MATLAB: An Introduction with Applications
Statistics
ISBN:9781119256830
Author:Amos Gilat
Publisher:John Wiley & Sons Inc

Probability and Statistics for Engineering and th...
Statistics
ISBN:9781305251809
Author:Jay L. Devore
Publisher:Cengage Learning

Statistics for The Behavioral Sciences (MindTap C...
Statistics
ISBN:9781305504912
Author:Frederick J Gravetter, Larry B. Wallnau
Publisher:Cengage Learning

Elementary Statistics: Picturing the World (7th E...
Statistics
ISBN:9780134683416
Author:Ron Larson, Betsy Farber
Publisher:PEARSON

The Basic Practice of Statistics
Statistics
ISBN:9781319042578
Author:David S. Moore, William I. Notz, Michael A. Fligner
Publisher:W. H. Freeman

Introduction to the Practice of Statistics
Statistics
ISBN:9781319013387
Author:David S. Moore, George P. McCabe, Bruce A. Craig
Publisher:W. H. Freeman