Advanced Engineering Mathematics
10th Edition
ISBN: 9780470458365
Author: Erwin Kreyszig
Publisher: Wiley, John & Sons, Incorporated
expand_more
expand_more
format_list_bulleted
Question

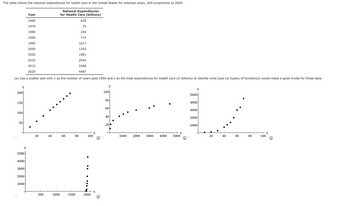
Transcribed Image Text:The table shows the national expenditures for health care in the United States for selected years, with projections to 2020.
National Expenditures
for Health Care (billions)
1960
$28
1970
75
1980
254
1990
714
IT
1995
1017
2000
1353
2005
1981
2010
2954
2015
3308
4487
(a) Use a scatter plot with x as the number of years past 1950 and y as the total expenditures for health care (in billions) to identify what type (or types) of function(s) would make a good model for these data.
y
200
150
100
50
Year
2020
20
40
60
y
5000
4000
U
3000
2000
1000
500
1000
80
1500
X
100
2000
X
y
y
5000
4000
PIZ
3000
2000
1000
X
3000 4000 5000
Q
100
80
60
40
20
1000
2000
20
40
60
80
100
X

Transcribed Image Text:(b) Find a power model and a quadratic model for the data. (Round all numerical values to four decimal places.)
y(x) =
power model
quadratic model y(x) =
(c) Which model from part (b) approximates more accurately the data point for 2020?
O power model
O quadratic model
(d) Use the quadratic model to predict the 2035 expenditures for national health care. (Round your answer to the nearest billion dollars.)
billion dollars
Expert Solution
This question has been solved!
Explore an expertly crafted, step-by-step solution for a thorough understanding of key concepts.
Step by stepSolved in 6 steps with 2 images

Knowledge Booster
Similar questions
- the table shows the percent of households with internet access for selected years from 2009 and projected through 2015. Year Percent of households 2009 67 2010 70 2011 72.5 2012 75 2013 76.5 2014 77.2 2015 78 Use the model to predict the percent of households with internet access in 2022.arrow_forwardThe table below show data that has been collected from different fields from various farms in a certain valley. The table contains the grams of Raspberries tested and the amount of their Vitamin C content in mg. Find a linear model that express Vitamin C content as a function of the weight of the Raspberries. grams 50 60 70 80 90 100 110 Vitamin C content in mg 9.3 14.3 18.9 23.5 27.5 31.7 36.9 A) Find the regression equation: y = places x + Round your answers to 3 decimal B) Answer the following questions using your un-rounded regression equation. If we test 140 grams of raspberries what is the expected Vitamin C content? nearest tenth) mg (round to thearrow_forwardLife expectancy in the United States has been rising since the nineteenth century. The table shows the U.S. life expectancy in selected years. Year 1950 1960 1970 1980 1990 2000 Life expectancy at birth 68.2 69.7 70.8 73.7 75.4 77 a. Let t represent the number of years after 1950, and plot the data. Draw a line a best fit for the data points. 80+ 76- 5 10 15 20 25 30 35 40 45 50 Draw: 72+ 64- 60+ 56 52 48- 44 Clear Allarrow_forward
- 97000 96000 95000 94000 93000 92000 91000 90000 89000 1000 Revenue vs TV Advertise 2000 3000 4000 5000 6000 97000 96000 95000 94000 93000 92000 91000 90000 89000 Revenue vs Print Advertise 1000 1500 2000 2500 3000 3500 4000 4500 Given above are the plots between weekly gross revenues and TV advertising and between weekly gross revenues and TV advertising for Showtime Movie Theaters. Which advertising (TV or Print) has a stronger relationship with the weekly gross revenues? O A. Print Advertising has stronger relationship with the weekly gross revenue. B. We cannot tell without calculating the related correlation coefficients. O C. TV Advertising has stronger relationship with the weekly gross revenue. O D. The strength of the relationships is the same for both advertising.arrow_forwardWhich ideas about functions do you think might be the most helpful to you in your day-to-day planning?arrow_forward
arrow_back_ios
arrow_forward_ios
Recommended textbooks for you
 Advanced Engineering MathematicsAdvanced MathISBN:9780470458365Author:Erwin KreyszigPublisher:Wiley, John & Sons, Incorporated
 Numerical Methods for EngineersAdvanced MathISBN:9780073397924Author:Steven C. Chapra Dr., Raymond P. CanalePublisher:McGraw-Hill Education
 Introductory Mathematics for Engineering Applicat...Advanced MathISBN:9781118141809Author:Nathan KlingbeilPublisher:WILEY
 Mathematics For Machine TechnologyAdvanced MathISBN:9781337798310Author:Peterson, John.Publisher:Cengage Learning,


Advanced Engineering Mathematics
Advanced Math
ISBN:9780470458365
Author:Erwin Kreyszig
Publisher:Wiley, John & Sons, Incorporated

Numerical Methods for Engineers
Advanced Math
ISBN:9780073397924
Author:Steven C. Chapra Dr., Raymond P. Canale
Publisher:McGraw-Hill Education

Introductory Mathematics for Engineering Applicat...
Advanced Math
ISBN:9781118141809
Author:Nathan Klingbeil
Publisher:WILEY

Mathematics For Machine Technology
Advanced Math
ISBN:9781337798310
Author:Peterson, John.
Publisher:Cengage Learning,

