
MATLAB: An Introduction with Applications
6th Edition
ISBN: 9781119256830
Author: Amos Gilat
Publisher: John Wiley & Sons Inc
expand_more
expand_more
format_list_bulleted
Related questions
Question
Part a through c please.
Thank you!

Transcribed Image Text:不
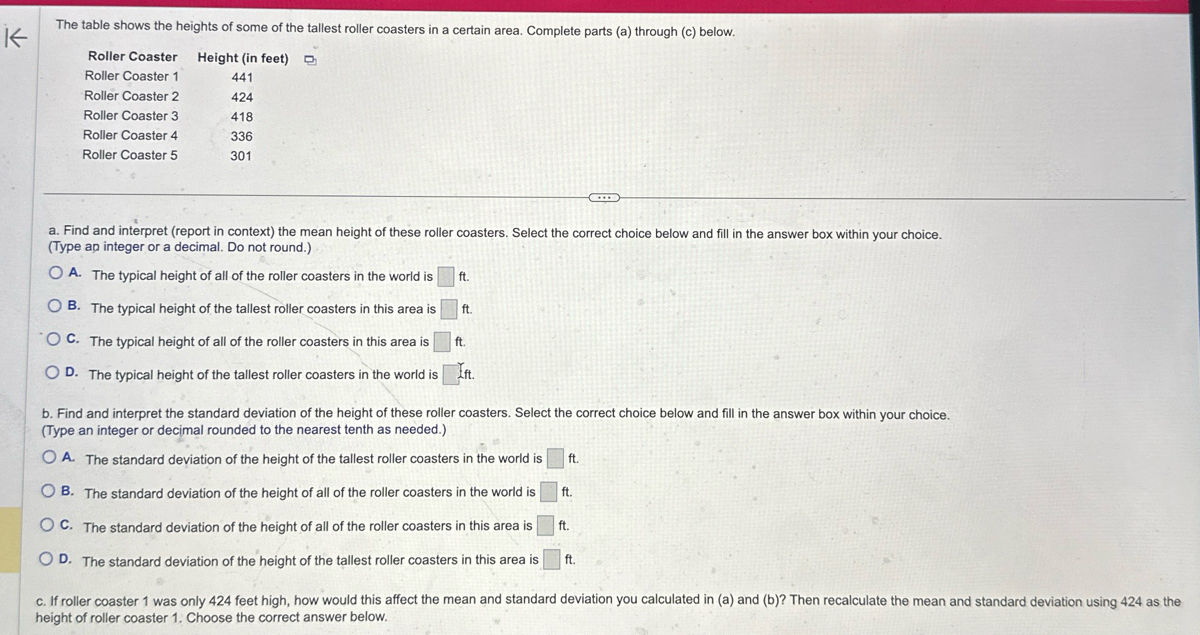
The table shows the heights of some of the tallest roller coasters in a certain area. Complete parts (a) through (c) below.
Roller Coaster Height (in feet)
Roller Coaster 1
441
Roller Coaster 2
424
Roller Coaster 3
418
Roller Coaster 4
Roller Coaster 5
336
301
a. Find and interpret (report in context) the mean height of these roller coasters. Select the correct choice below and fill in the answer box within your choice.
(Type an integer or a decimal. Do not round.)
OA. The typical height of all of the roller coasters in the world is
ft.
B. The typical height of the tallest roller coasters in this area is
OC. The typical height of all of the roller coasters in this area is
ft.
ft.
OD. The typical height of the tallest roller coasters in the world is ft.
b. Find and interpret the standard deviation of the height of these roller coasters. Select the correct choice below and fill in the answer box within your choice.
(Type an integer or decimal rounded to the nearest tenth as needed.)
OA. The standard deviation of the height of the tallest roller coasters in the world is
OB. The standard deviation of the height of all of the roller coasters in the world is
OC. The standard deviation of the height of all of the roller coasters in this area is
OD. The standard deviation of the height of the tallest roller coasters in this area is
ft.
ft.
ft.
ft.
c. If roller coaster 1 was only 424 feet high, how would this affect the mean and standard deviation you calculated in (a) and (b)? Then recalculate the mean and standard deviation using 424 as the
height of roller coaster 1. Choose the correct answer below.

Transcribed Image Text:The table shows the heights of some of the tallest roller coasters in a certain area. Complete parts (a) through (c) below.
Roller Coaster
Height (in feet)
Roller Coaster 1
441
Roller Coaster 2
424
Roller Coaster 3
418
Roller Coaster 4
336
Roller Coaster 5
301
A. The standard deviation of the height of the tallest roller coasters in the world is
OB. The standard deviation of the height of all of the roller coasters in the world is
OC. The standard deviation of the height of all of the roller coasters in this area is
OD. The standard deviation of the height of the tallest roller coasters in this area is
ft.
ft.
ft.
ft.
c. If roller coaster 1 was only 424 feet high, how would this affect the mean and standard deviation you calculated in (a) and (b)? Then recalculate the mean and standard deviation using 424 as the
height of roller coaster 1. Choose the correct answer below.
OA. The mean and standard deviation will decrease.
OB. The mean will increase and the standard deviation will decrease.
OC. The mean will decrease and the standard deviation will increase.
OD. The mean and standard deviation will increase.
Now recalculate the mean and standard deviation using 424 as the height of roller coaster 1.
The new mean is
ft.
The new standard deviation is
ft.
(Type integers or decimals rounded to the nearest tenth as needed.)
Expert Solution
This question has been solved!
Explore an expertly crafted, step-by-step solution for a thorough understanding of key concepts.

Step by stepSolved in 2 steps with 2 images

Knowledge Booster

Similar questions
- Help with all please.arrow_forwardThe sale price for bananas is $3 for 4 pounds.At that rate,how much would 14 pounds of bananas cost?arrow_forwardYou have a collection of nickels and quarters worth $8.10. If the nickels were quarters and the quarters were nickels, the value would be $17.70. How many of each coin do you have? 24.arrow_forward
- Kara categorized her spending for this month into four categories: Rent, Food, Fun, and Other. The amounts she spent in each category are pictured here.Rent $528 Food $422 Fun $317 Other $633How much total money did Kara spend this month?arrow_forwardPlease answer question #5a with details on how to do it. Make handwriting legible please when writing out x,y,z etc. Thank you.arrow_forwardPlease answer question #5b with details on how to do it. Make handwriting legible please when writing out x,y,z etc. Thank you.arrow_forward
arrow_back_ios
arrow_forward_ios
Recommended textbooks for you
- MATLAB: An Introduction with ApplicationsStatisticsISBN:9781119256830Author:Amos GilatPublisher:John Wiley & Sons Inc
 Probability and Statistics for Engineering and th...StatisticsISBN:9781305251809Author:Jay L. DevorePublisher:Cengage Learning
 Statistics for The Behavioral Sciences (MindTap C...StatisticsISBN:9781305504912Author:Frederick J Gravetter, Larry B. WallnauPublisher:Cengage Learning
  Elementary Statistics: Picturing the World (7th E...StatisticsISBN:9780134683416Author:Ron Larson, Betsy FarberPublisher:PEARSON
 The Basic Practice of StatisticsStatisticsISBN:9781319042578Author:David S. Moore, William I. Notz, Michael A. FlignerPublisher:W. H. Freeman
 Introduction to the Practice of StatisticsStatisticsISBN:9781319013387Author:David S. Moore, George P. McCabe, Bruce A. CraigPublisher:W. H. Freeman
MATLAB: An Introduction with Applications
Statistics
ISBN:9781119256830
Author:Amos Gilat
Publisher:John Wiley & Sons Inc
Probability and Statistics for Engineering and th...
Statistics
ISBN:9781305251809
Author:Jay L. Devore
Publisher:Cengage Learning
Statistics for The Behavioral Sciences (MindTap C...
Statistics
ISBN:9781305504912
Author:Frederick J Gravetter, Larry B. Wallnau
Publisher:Cengage Learning
Elementary Statistics: Picturing the World (7th E...
Statistics
ISBN:9780134683416
Author:Ron Larson, Betsy Farber
Publisher:PEARSON
The Basic Practice of Statistics
Statistics
ISBN:9781319042578
Author:David S. Moore, William I. Notz, Michael A. Fligner
Publisher:W. H. Freeman
Introduction to the Practice of Statistics
Statistics
ISBN:9781319013387
Author:David S. Moore, George P. McCabe, Bruce A. Craig
Publisher:W. H. Freeman