
ENGR.ECONOMIC ANALYSIS
14th Edition
ISBN: 9780190931919
Author: NEWNAN
Publisher: Oxford University Press
expand_more
expand_more
format_list_bulleted
Related questions
Question
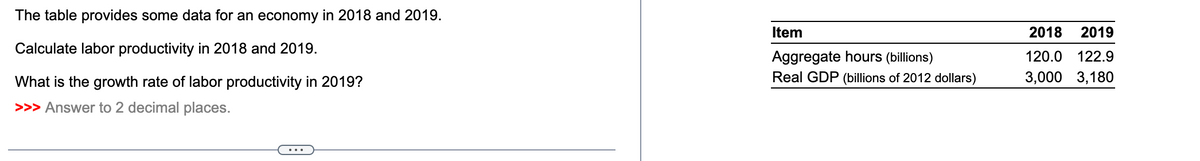

Transcribed Image Text:The table provides some data for an economy in 2018 and 2019.
Calculate labor productivity in 2018 and 2019.
What is the growth rate of labor productivity in 2019?
>>> Answer to 2 decimal places.
Item
Aggregate hours (billions)
Real GDP (billions of 2012 dollars)
2018 2019
120.0 122.9
3,000 3,180
Expert Solution
This question has been solved!
Explore an expertly crafted, step-by-step solution for a thorough understanding of key concepts.

Step by stepSolved in 4 steps with 4 images

Knowledge Booster


Learn more about
Need a deep-dive on the concept behind this application? Look no further. Learn more about this topic, economics and related others by exploring similar questions and additional content below.Similar questions
- Why do economists measure growth in real terms as opposed to nominal terms? Explain why real GDP a useful and important measure of a nation’s economic health? Who uses this information?arrow_forwardIn 2017, the GDP of UK was $2100. Suppose that UK has a growth rate of 2.3%. a. What is Britain's GDP after 8 years? b. What is Britain's GDP after 12 years?arrow_forwardThe table below shows data over several years for a country's real GDP, the number of full-time employed workers (E), and the annual average number of hours worked per worker (H). a. & b. For each of the four years, compute real GDP per worker-a standard measure of labour productivity and a slightly more complex measure of labour productivity-real GDP per hour worked. (Round your answers to the nearest cent.) Year 1 5 10 15 Real GDP $525 billion $574 billion $655 billion $767 billion Full-time Employed Workers (E) 12.7 million 13.5 million 14.5 million 15.2 million Number of Hours Worked per Worker (H) 2011 1961 1937 1905 GDP E GDP EXHarrow_forward
- Table 11.Growth (in Trillions) Real Year GDP 2015 16.30 2014 16.29 2013 15.92 2012 15.43 2011 15.19 2010 14.94 2009 14.54 Refer to Table 11.Growth. Economic growth rate for 2013 is about О 2.32% O 1.67% O 1.58% О 3.18%arrow_forwardReal GDP in 2015 was SAR 12,247 billion. It was SAR13,206 billion in 2018. The population of Saudi Arabia increased from 22.9 million to 25.4 million over this time. a. Determine the actual GDP per person for 2015 and 2018. How much did output per individual increase throughout this time, on average? b. What would real GDP have been in 2018 if real GDP had increased by 3% year from -2015 to 2018?arrow_forwardThe table shows data for changes in nominal GDP, the price level, and population in 2013. Use these data to calculate the approximate economic growth rate, or the annual growth rate, of real GDP per capita. Specify your answer to one decimal place. %A in nominal GDP growth rate: 5.0 %A price level 1.1 %A population 1.5 %arrow_forward
- 1. Economic growth around the world The following table reports real income per person for several different economies in the years 1960 and 2010. It also gives each economy's average annual growth rate during his period. For example, real income per person in Niger was $945 in 1960, and it actually declined to $570 by 2010. Niger's average annual growth rate during this period was -1.01%, and it was the poorest economy in the table in the year 2010. The real income-per-person figures are denominated in U.S. dollars with a base year of 2005. The following exercises will help you to understand the different growth experiences of these economies. Economy Canada United Kingdom Korea Hong Kong Guatemala Niger Real Income per Person in 1960 Real Income per Person in 2010 (Dollars) (Dollars) 35,810 12,946 11,884 32,034 1,610 28,702 4,518 44,070 1,985 3,859 945 570 Annual Growth Rate (Percent) 2.06 2.00 5.93 4.66 1.34 -1.01arrow_forwardAssuming UAE’s 2021 economic growth is projected to be 3.5%. How long will it take to double the size of that economy? Show your calculations.arrow_forward
arrow_back_ios
arrow_forward_ios
Recommended textbooks for you
 Principles of Economics (12th Edition)EconomicsISBN:9780134078779Author:Karl E. Case, Ray C. Fair, Sharon E. OsterPublisher:PEARSON
 Engineering Economy (17th Edition)EconomicsISBN:9780134870069Author:William G. Sullivan, Elin M. Wicks, C. Patrick KoellingPublisher:PEARSON
 Principles of Economics (MindTap Course List)EconomicsISBN:9781305585126Author:N. Gregory MankiwPublisher:Cengage Learning
 Managerial Economics: A Problem Solving ApproachEconomicsISBN:9781337106665Author:Luke M. Froeb, Brian T. McCann, Michael R. Ward, Mike ShorPublisher:Cengage Learning
 Managerial Economics & Business Strategy (Mcgraw-...EconomicsISBN:9781259290619Author:Michael Baye, Jeff PrincePublisher:McGraw-Hill Education
Principles of Economics (12th Edition)
Economics
ISBN:9780134078779
Author:Karl E. Case, Ray C. Fair, Sharon E. Oster
Publisher:PEARSON
Engineering Economy (17th Edition)
Economics
ISBN:9780134870069
Author:William G. Sullivan, Elin M. Wicks, C. Patrick Koelling
Publisher:PEARSON
Principles of Economics (MindTap Course List)
Economics
ISBN:9781305585126
Author:N. Gregory Mankiw
Publisher:Cengage Learning
Managerial Economics: A Problem Solving Approach
Economics
ISBN:9781337106665
Author:Luke M. Froeb, Brian T. McCann, Michael R. Ward, Mike Shor
Publisher:Cengage Learning
Managerial Economics & Business Strategy (Mcgraw-...
Economics
ISBN:9781259290619
Author:Michael Baye, Jeff Prince
Publisher:McGraw-Hill Education