
Structural Analysis
6th Edition
ISBN: 9781337630931
Author: KASSIMALI, Aslam.
Publisher: Cengage,
expand_more
expand_more
format_list_bulleted
Related questions
Concept explainers
Question
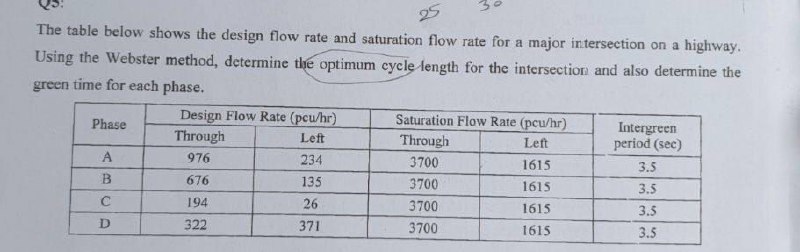

Transcribed Image Text:25
The table below shows the design flow rate and saturation flow rate for a major intersection on a highway.
Using the Webster method, determine the optimum cycle length for the intersection and also determine the
green time for each phase.
Design Flow Rate (pcu/hr)
Through
Phase
Saturation Flow Rate (pcu/hr)
Intergreen
period (sec)
Left
Through
Left
A
976
234
3700
1615
3.5
676
135
3700
1615
3.5
194
26
3700
1615
3.5
322
371
3700
1615
3.5
Expert Solution
This question has been solved!
Explore an expertly crafted, step-by-step solution for a thorough understanding of key concepts.

Step by stepSolved in 2 steps with 2 images

Knowledge Booster


Learn more about
Need a deep-dive on the concept behind this application? Look no further. Learn more about this topic, civil-engineering and related others by exploring similar questions and additional content below.Recommended textbooks for you
 Structural Analysis (10th Edition)Civil EngineeringISBN:9780134610672Author:Russell C. HibbelerPublisher:PEARSON
 Principles of Foundation Engineering (MindTap Cou...Civil EngineeringISBN:9781337705028Author:Braja M. Das, Nagaratnam SivakuganPublisher:Cengage Learning
 Fundamentals of Structural AnalysisCivil EngineeringISBN:9780073398006Author:Kenneth M. Leet Emeritus, Chia-Ming Uang, Joel LanningPublisher:McGraw-Hill Education
 Traffic and Highway EngineeringCivil EngineeringISBN:9781305156241Author:Garber, Nicholas J.Publisher:Cengage Learning
Structural Analysis (10th Edition)
Civil Engineering
ISBN:9780134610672
Author:Russell C. Hibbeler
Publisher:PEARSON
Principles of Foundation Engineering (MindTap Cou...
Civil Engineering
ISBN:9781337705028
Author:Braja M. Das, Nagaratnam Sivakugan
Publisher:Cengage Learning
Fundamentals of Structural Analysis
Civil Engineering
ISBN:9780073398006
Author:Kenneth M. Leet Emeritus, Chia-Ming Uang, Joel Lanning
Publisher:McGraw-Hill Education
Traffic and Highway Engineering
Civil Engineering
ISBN:9781305156241
Author:Garber, Nicholas J.
Publisher:Cengage Learning