Human Anatomy & Physiology (11th Edition)
11th Edition
ISBN: 9780134580999
Author: Elaine N. Marieb, Katja N. Hoehn
Publisher: PEARSON
expand_more
expand_more
format_list_bulleted
Concept explainers
Question

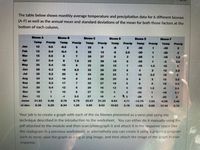
Transcribed Image Text:The table below shows monthly average temperature and precipitation data for 6 different biomes
(A-F) as well as the annual mean and standard deviations of the mean for both those factors at the
bottom of each column.
Biome A
Biome B
Biome C
Biome D
Biome E
Biome F
Temp
Precip
Temp
Precip
Temp
Precip
Temp
Precip
Temp
Precip
Temp
Precip
Jan
12
0.5
-0.5
25
2.
35
-30
2.
Feb
13
0.4
-0.4
26
12
2.5
-30
-25
Mar
15
0.5
7
26
27
-25
-18
1.5
Apr
21
0.4
7.5
26
28
2.5
May
25
0.4
15
25
29
1.5
10
Jun
28
0.3
18
8.5
25
28
20
3.5
Jul
35
0.2
20
26
29
10
18
4
Aug
34
0.3
19
8
24
28
20
Sep
30
0.3
17
25
27
18
2
10
2.4
Oct
20
0.4
12
26
16
12
4
10
1.5
4
2.3
Nov
18
10
27
12
3
-25
-18
2.1
Dec
12
-1
5.5
27
10
-1
-28
-25
mean
21.92
0.48
9.76
6.79
25.67
21.25
8.83
4.71
13.75
1.54
4.58
2.48
st dev.
8.38
0.26
8.34
1.25
0.89
8.52
10.62
2.18
15.53
0.69
17.95
0.70
Your job is to create a graph with each of the six biomes presented as a venn plot using the
technique described in the introduction to the worksheet. You can either do it manually using the
pdf attached to the module and then scan/photograph it and attach it in the response space (like
the cladogram in a previous worksheet), or alternatively you can create it using a graphing program.
such as excel, save the graph as a jpg or png image, and then attach the image of the graph in your
response.
Expert Solution
This question has been solved!
Explore an expertly crafted, step-by-step solution for a thorough understanding of key concepts.
This is a popular solution
Trending nowThis is a popular solution!
Step by stepSolved in 2 steps with 1 images

Knowledge Booster
Learn more about
Need a deep-dive on the concept behind this application? Look no further. Learn more about this topic, biology and related others by exploring similar questions and additional content below.Similar questions
- Choose 3 Biomes. Explain how human activity has contributed to its disturbance.arrow_forwardThe graph shows that the atmosphere is currently warmer than it has been in Global Mean Temperature over Land & Ocean 0.6 0.4 0.2 0.0 -0.2 -0.4 -0.6 L 1 1940 1920 1960 anomaly ("C) relative to 1961-1990 1880 1900 O 100 years O 1,000 years O 120 years O 1,200 years year ↓ L 1980 2000arrow_forwardWhen was the last time sea surface temperatures were below the 20th century average?arrow_forward
- Use the data and graph below to completely and correctly answer these two questions: 5. Based on your data in Table 2 and Figure 2., how do rainfall/temperature correlate with productivity/diversity in biomes? 6. Suggest a hypothesis to explain the correlation in question 5. Label the answers and don’t use previous answers/versions. Be complete and correctarrow_forwardAbout how much warming occurred at Concord between 1852 and 2006? 0.5 C 1.0 C O 2.0 C O 2.5 Carrow_forwardWhich of the following are the two major abiotic factors that determine a biome? Question 6 options: average daily high and low temperature temperature and precipitation air and water rainfall and snowfallarrow_forward
- Create a bar graph that ranks the given ecosystems from least productive to most productive. Title your graph, label each axis, label each bar, and provide units of measurement. Use the data in the table below showing net primary productivity of major ecosystems of the world: Ecosystem Net Primary Productivity (kcal/m2/yr) coniferous forests 3,500 deciduous forests 6,000 deserts 500 estuaries 9,000 freshwater ecosystems 2,000 grasslands 2,500 oceans 1,000 swamps 9,000 tropical rain forests 9,000 tundra 750arrow_forwardTerrestrial Biomes Which biome experiences both the lowest average temperatures and the lowest average precipitation? (Use the climatograph to answer this question.) O Chapparal Desert O Northern Coniferous Forest (Taiga) O Savanna Temperate Broadleaf Forest Temperate Grassland Tropical Forest Tundra Question 5 0.5 ptarrow_forwardUse the data below to fill out the graph. For each biome, put a dot on the graph and label it correctly.arrow_forward
arrow_back_ios
arrow_forward_ios
Recommended textbooks for you
 Human Anatomy & Physiology (11th Edition)BiologyISBN:9780134580999Author:Elaine N. Marieb, Katja N. HoehnPublisher:PEARSON
 Biology 2eBiologyISBN:9781947172517Author:Matthew Douglas, Jung Choi, Mary Ann ClarkPublisher:OpenStax
 Anatomy & PhysiologyBiologyISBN:9781259398629Author:McKinley, Michael P., O'loughlin, Valerie Dean, Bidle, Theresa StouterPublisher:Mcgraw Hill Education,
 Molecular Biology of the Cell (Sixth Edition)BiologyISBN:9780815344322Author:Bruce Alberts, Alexander D. Johnson, Julian Lewis, David Morgan, Martin Raff, Keith Roberts, Peter WalterPublisher:W. W. Norton & Company
 Laboratory Manual For Human Anatomy & PhysiologyBiologyISBN:9781260159363Author:Martin, Terry R., Prentice-craver, CynthiaPublisher:McGraw-Hill Publishing Co.
 Inquiry Into Life (16th Edition)BiologyISBN:9781260231700Author:Sylvia S. Mader, Michael WindelspechtPublisher:McGraw Hill Education

Human Anatomy & Physiology (11th Edition)
Biology
ISBN:9780134580999
Author:Elaine N. Marieb, Katja N. Hoehn
Publisher:PEARSON

Biology 2e
Biology
ISBN:9781947172517
Author:Matthew Douglas, Jung Choi, Mary Ann Clark
Publisher:OpenStax

Anatomy & Physiology
Biology
ISBN:9781259398629
Author:McKinley, Michael P., O'loughlin, Valerie Dean, Bidle, Theresa Stouter
Publisher:Mcgraw Hill Education,

Molecular Biology of the Cell (Sixth Edition)
Biology
ISBN:9780815344322
Author:Bruce Alberts, Alexander D. Johnson, Julian Lewis, David Morgan, Martin Raff, Keith Roberts, Peter Walter
Publisher:W. W. Norton & Company

Laboratory Manual For Human Anatomy & Physiology
Biology
ISBN:9781260159363
Author:Martin, Terry R., Prentice-craver, Cynthia
Publisher:McGraw-Hill Publishing Co.

Inquiry Into Life (16th Edition)
Biology
ISBN:9781260231700
Author:Sylvia S. Mader, Michael Windelspecht
Publisher:McGraw Hill Education