
MATLAB: An Introduction with Applications
6th Edition
ISBN: 9781119256830
Author: Amos Gilat
Publisher: John Wiley & Sons Inc
expand_more
expand_more
format_list_bulleted
Related questions
Question
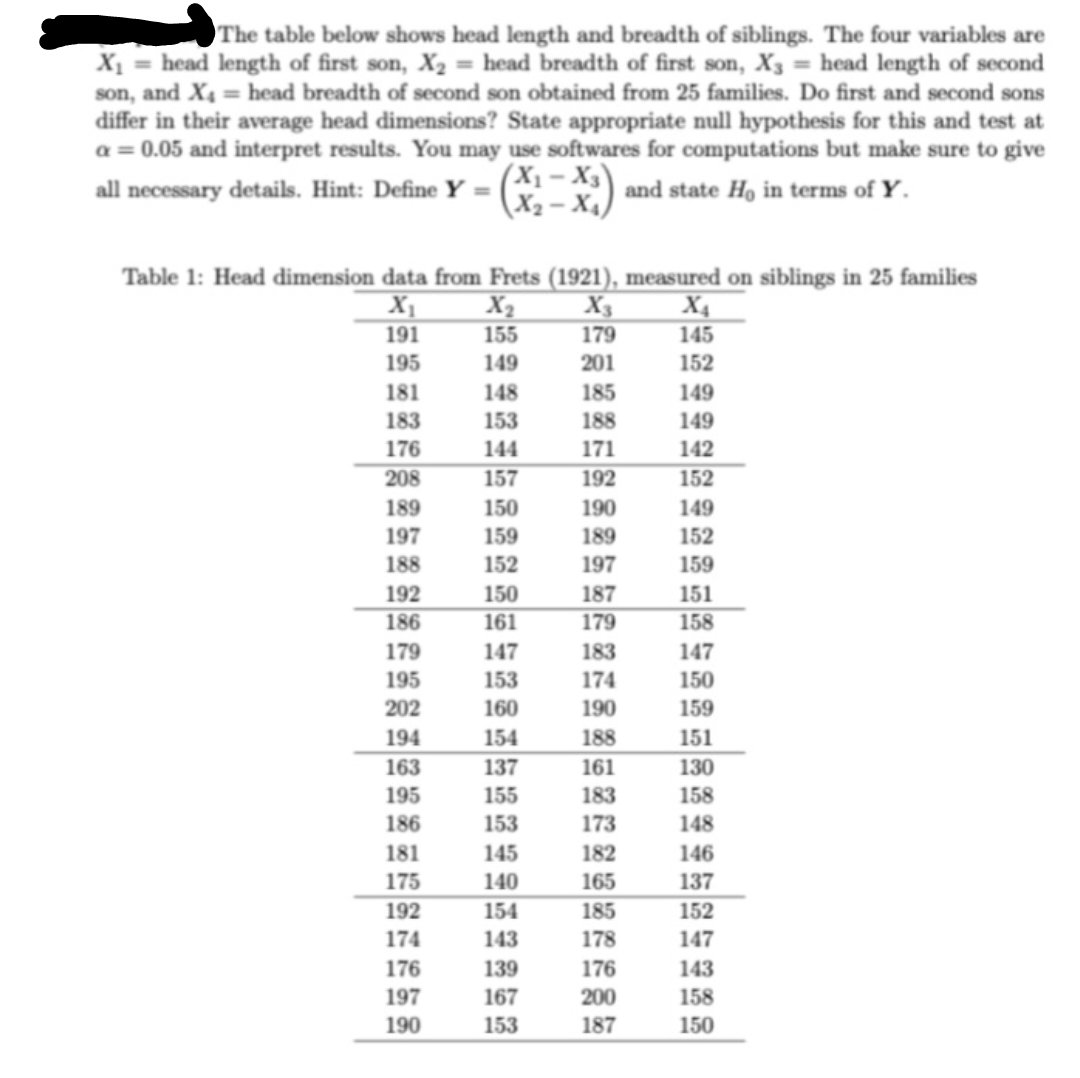

Transcribed Image Text:The table below shows head length and breadth of siblings. The four variables are
X₁ = head length of first son, X₂ = head breadth of first son, X3 = head length of second
son, and X₁ = head breadth of second son obtained from 25 families. Do first and second sons
differ in their average head dimensions? State appropriate null hypothesis for this and test at
a = 0.05 and interpret results. You may use softwares for computations but make sure to give
(X₁-X3)
all necessary details. Hint: Define Y =
and state Ho in terms of Y.
(X₂-X₁)
Table 1: Head dimension data from Frets (1921), measured on siblings in 25 families
X₁
X₂
191
155
195
149
181
183
176
208
189
197
188
192
186
179
195
202
194
163
195
186
181
175
192
174
176
197
190
148
153
144
157
150
159
152
150
161
147
153
160
154
137
155
153
145
140
154
143
139
167
153
X3
179
201
185
188
171
192
190
189
197
187
179
183
174
190
188
161
183
173
182
165
185
178
176
200
187
X4
145
152
149
149
142
152
149
152
159
151
158
147
150
159
151
130
158
148
146
137
152
147
143
158
150
Expert Solution
This question has been solved!
Explore an expertly crafted, step-by-step solution for a thorough understanding of key concepts.

Step by stepSolved in 3 steps with 3 images

Knowledge Booster

Similar questions
- A laboratory research group did a microarray experiment five years ago with 10 subjects in the normal group, and 6 subjects in the diet group; one microarray per subject. They never published their results because they felt like their diet group was too small. Now they have more money and they want to get 4 diet animals, and run 4 new microarrays on those animals. They plan to add that data to their study so they can increase their statistical discovery power, and finally publish their results. Although increasing the number of subjects should increase the statistical power of the study, give a reason why increasing the number of samples might NOT result in more significant results.arrow_forwardCan you provide an example of a chi-square test?arrow_forwardBefore every flight, the pilot must verify that the total weight of the load is less than the maximum allowable load for the aircraft. The aircraft can carry 42 passengers, and a flight has fuel and baggage that allows for a total passenger load of 7,056 lb. The pilot sees that the plane is full and all passengers are men. The aircraft will be overloaded if the mean weight of the passengers is greater than 7,056 lb42=168 lb. What is the probability that the aircraft is overloaded? Should the pilot take any action to correct for an overloaded aircraft? Assume that weights of men are normally distributed with a mean of 178.3 lb and a standard deviation of 36.8.arrow_forward
- A least squares line for a sample with 11 observations has an SSE = 192; calculate and s. Please show your work So i can understand how you arrived at the answerarrow_forwardHello, When I sum up the variance, I'm getting 2.75. And not 1.65. Also, how did you get the xi-mean in each column? Thanksarrow_forwardThe mean height of a certain kind of plant is 170 centimeters. Suppose we want to carry out a hypothesis test to see if the mean height when these plants are treated with a certain chemical differs from 170. State the null hypothesis H0 and the alternative hypothesis H1 that we would use for this test.arrow_forward
- Before every flight, the pilot must verify that the total weight of the load is less than the maximum allowable load for the aircraft. The aircraft can carry 43 passengers, and a flight has fuel and baggage that allows for a total passenger load of 7,009 lb. The pilot sees that the plane is full and all passengers are men. The aircraft will be overloaded if the mean weight of the passengers is greater than 7,009 lb / 43 =163 lb. What is the probability that the aircraft is overloaded? Should the pilot take any action to correct for an overloaded aircraft? Assume that weights of men are normally distributed with a mean of 182.4 lb and a standard deviation of 38.4.arrow_forwardBefore every flight, the pilot must verify that the total weight of the load is less than the maximum allowable load for the aircraft. The aircraft can carry 37 passengers, and a flight has fuel and baggage that allows for a total passenger load of 5,994lb. The pilot sees that the plane is full and all passengers are men. The aircraft will be overloaded if the mean weight of the passengers is greater than 5,994/37lb=162lb. What is the probability that the aircraft is overloaded? Should the pilot take any action to correct for an overloaded aircraft? Assume that weights of men are normally distributed with a mean of 181.6lb and a standard deviation of 36.2. The probability is approximately?arrow_forwardBefore every flight, the pilot must verify that the total weight of the load is less than the maximum allowable load for the aircraft. The aircraft can carry 42 passengers, and a flight has fuel and baggage that allows for the total passenger load of 6,972lb. The pilot sees that the plane is full and all the passengers are men. The aircraft will be overloaded if the mean weight of the passengers is greater than 6,972lb/42=166lb. What is the probability that the aircraft is overloaded? Should the pilot take any action to correct for an overloaded aircraft? Assume that the weights of men are normally distributed with a mean of 176.9lb and a standard deviation of 37.7. THE probability is approximately. ? Round to four decimal places.arrow_forward
arrow_back_ios
arrow_forward_ios
Recommended textbooks for you
- MATLAB: An Introduction with ApplicationsStatisticsISBN:9781119256830Author:Amos GilatPublisher:John Wiley & Sons Inc
 Probability and Statistics for Engineering and th...StatisticsISBN:9781305251809Author:Jay L. DevorePublisher:Cengage Learning
 Statistics for The Behavioral Sciences (MindTap C...StatisticsISBN:9781305504912Author:Frederick J Gravetter, Larry B. WallnauPublisher:Cengage Learning
  Elementary Statistics: Picturing the World (7th E...StatisticsISBN:9780134683416Author:Ron Larson, Betsy FarberPublisher:PEARSON
 The Basic Practice of StatisticsStatisticsISBN:9781319042578Author:David S. Moore, William I. Notz, Michael A. FlignerPublisher:W. H. Freeman
 Introduction to the Practice of StatisticsStatisticsISBN:9781319013387Author:David S. Moore, George P. McCabe, Bruce A. CraigPublisher:W. H. Freeman
MATLAB: An Introduction with Applications
Statistics
ISBN:9781119256830
Author:Amos Gilat
Publisher:John Wiley & Sons Inc
Probability and Statistics for Engineering and th...
Statistics
ISBN:9781305251809
Author:Jay L. Devore
Publisher:Cengage Learning
Statistics for The Behavioral Sciences (MindTap C...
Statistics
ISBN:9781305504912
Author:Frederick J Gravetter, Larry B. Wallnau
Publisher:Cengage Learning
Elementary Statistics: Picturing the World (7th E...
Statistics
ISBN:9780134683416
Author:Ron Larson, Betsy Farber
Publisher:PEARSON
The Basic Practice of Statistics
Statistics
ISBN:9781319042578
Author:David S. Moore, William I. Notz, Michael A. Fligner
Publisher:W. H. Freeman
Introduction to the Practice of Statistics
Statistics
ISBN:9781319013387
Author:David S. Moore, George P. McCabe, Bruce A. Craig
Publisher:W. H. Freeman