MATLAB: An Introduction with Applications
6th Edition
ISBN: 9781119256830
Author: Amos Gilat
Publisher: John Wiley & Sons Inc
expand_more
expand_more
format_list_bulleted
Topic Video
Question

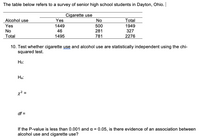
Transcribed Image Text:The table below refers to a survey of senior high school students in Dayton, Ohio.
Cigarette use
Yes
Alcohol use
Yes
No
Total
1949
327
1449
500
No
46
281
Total
1495
781
2276
10. Test whether cigarette use and alcohol use are statistically independent using the chi-
squared test.
Но:
На:
x? =
df =
If the P-value is less than 0.001 and a = 0.05, is there evidence of an association between
alcohol use and cigarette use?
Expert Solution
This question has been solved!
Explore an expertly crafted, step-by-step solution for a thorough understanding of key concepts.
This is a popular solution
Trending nowThis is a popular solution!
Step by stepSolved in 3 steps with 7 images

Knowledge Booster
Learn more about
Need a deep-dive on the concept behind this application? Look no further. Learn more about this topic, statistics and related others by exploring similar questions and additional content below.Similar questions
- A researcher is trying to determine if there is a significant relationship between number of hours spent cycling each week and resting heart rate among study participants. Which procedure should he use? Group of answer choices: Mean ANOVA One-way chi square Correlationarrow_forwardIq and lead exposure. A sample of subjects with low lead levels in their blood was taken and another random sample was taken with high levels of lead in their blood. Use a 0.05 significant level to test claim that iq score of people p le w low lead levels is higher than the mean iq score of people w higher lead levels. Use p value approach LLL N =78 SAMPLE MEAN=92.88 S=15.34 HLL N=21 SM= 86.90 S=8.99arrow_forwardStudents in an experimental psychology class did research on depression as a sign of stress. A test was administered to a sample of 30 students. The scores are given. Complete parts (a) through (c) below. 32 54 11 15 35 21 OA. 158 34 15 55 51 11 35 2 1457 3 1234567 4123445566 511245666 34 33 46 OB. 11155 (a) Find the mean and median of the data. The mean is . (Round to three decimal places as needed.) 44 26 27 The median is .(Type an integer or a decimal.) (b) Draw a stem-and-leaf plot for the data using one row per stem. Which stem-and-leaf plot below shows the data? 2 112677 3 233445556 4 244666 5 1456 ... 21 42 38 OA. The distribution is symmetric. B. The distribution is skewed right (positively skewed). OC. The distribution is skewed left (negatively skewed). O D. The distribution is uniform. (c) Describe the shape of the distribution. Which description below best describes the shape of the distribution? 56 46 OC. 1112455668 2 14556 3 15 4 13457 5 223446667 46 27 33 35 22 44 36 0…arrow_forward
- Can someone answer g.) h.) and i.) please?arrow_forwardWomen stereotypically talk more than men do and researchers wondered how much more. Suppose a study attempted to determine the difference in the mean number of words spoken by men or women per day. The results of the study are summarized in the table. Group Populationmean Samplesize Samplemean Sample standarddeviation Standard errorestimate women ?w (unknown) ?w= 36 ?⎯⎯⎯w= 14704 ?w=6215 SEw=1036 men ?m (unknown) ?m= 24 ?⎯⎯⎯m= 15022 ?m=7864 SEm=1605 df=41.4224 Assume the conditions are satisfied for a two‑sample ?‑confidence interval. First, determine the positive critical value, ?, for a 95% confidence interval to estimate how many more words women speak each day on average compared to men, ?w−?m. Give your answer precise to at least three decimal places. Determine lower and upper limits of a 95% confidence interval for how many more words speak each day on average compared to men. A negative number would indicate how many fewer words women speak each day on average…arrow_forwardOne group's measure of math anxiety following a stress management seminar (pre and post test scores). A. T-test independent samples B. T-test dependent samples C. One-way ANOVA D. Correlation E. Chi square F. Simple Regressionarrow_forward
arrow_back_ios
arrow_forward_ios
Recommended textbooks for you
 MATLAB: An Introduction with ApplicationsStatisticsISBN:9781119256830Author:Amos GilatPublisher:John Wiley & Sons Inc
 Probability and Statistics for Engineering and th...StatisticsISBN:9781305251809Author:Jay L. DevorePublisher:Cengage Learning
 Statistics for The Behavioral Sciences (MindTap C...StatisticsISBN:9781305504912Author:Frederick J Gravetter, Larry B. WallnauPublisher:Cengage Learning
 Elementary Statistics: Picturing the World (7th E...StatisticsISBN:9780134683416Author:Ron Larson, Betsy FarberPublisher:PEARSON
 The Basic Practice of StatisticsStatisticsISBN:9781319042578Author:David S. Moore, William I. Notz, Michael A. FlignerPublisher:W. H. Freeman
 Introduction to the Practice of StatisticsStatisticsISBN:9781319013387Author:David S. Moore, George P. McCabe, Bruce A. CraigPublisher:W. H. Freeman

MATLAB: An Introduction with Applications
Statistics
ISBN:9781119256830
Author:Amos Gilat
Publisher:John Wiley & Sons Inc

Probability and Statistics for Engineering and th...
Statistics
ISBN:9781305251809
Author:Jay L. Devore
Publisher:Cengage Learning

Statistics for The Behavioral Sciences (MindTap C...
Statistics
ISBN:9781305504912
Author:Frederick J Gravetter, Larry B. Wallnau
Publisher:Cengage Learning

Elementary Statistics: Picturing the World (7th E...
Statistics
ISBN:9780134683416
Author:Ron Larson, Betsy Farber
Publisher:PEARSON

The Basic Practice of Statistics
Statistics
ISBN:9781319042578
Author:David S. Moore, William I. Notz, Michael A. Fligner
Publisher:W. H. Freeman

Introduction to the Practice of Statistics
Statistics
ISBN:9781319013387
Author:David S. Moore, George P. McCabe, Bruce A. Craig
Publisher:W. H. Freeman