Algebra and Trigonometry (6th Edition)
6th Edition
ISBN: 9780134463216
Author: Robert F. Blitzer
Publisher: PEARSON
expand_more
expand_more
format_list_bulleted
Concept explainers
Question
thumb_up100%

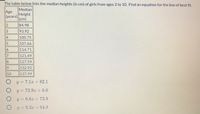
Transcribed Image Text:The table below lists the median heights (in cm) of girls from ages 2 to 10. Find an equation for the line of best fit.
Median
Height
(cm)
84.98
Age
(years)
2
93.92
4
100.75
107.66
114.71
121.49
127.59
69
132.92
10
137.99
y = 7.1x + 82.1
y = 73.9x + 6.6
y = 6.6x + 73.9
y = 9.3x + 84.9
Expert Solution
arrow_forward
Step 1
According to the question, we have list of median heights of girls from ages 2 to 10.
We need to calculate the equation of best fit line for this data set.
We know that, Regression equation can be written as:
Y= bX + a
where b= (SP/SSx)
a= My - b*Mx
Trending nowThis is a popular solution!
Step by stepSolved in 2 steps

Knowledge Booster
Learn more about
Need a deep-dive on the concept behind this application? Look no further. Learn more about this topic, algebra and related others by exploring similar questions and additional content below.Similar questions
- The scatter plot and line of best fit below show the length of 11 people’s femur and their height in centimeters what is the meaning of the x-value on the line when y = 150arrow_forwardplease answer A and B thank you.arrow_forwardes The box plot shows the undergraduate in-state tuition per credit hour at four-year public colleges. 1,500 1,200 900 600 300 0 a. Estimate the median. Medianarrow_forward
- please help answer fullyarrow_forwardList the approximate median number of people per square mile for each location, for example, the median for region A approximately 210.arrow_forwardHallux abducto valgus (call it HAV) is a deformation of the big toe that often requires surgery. Doctors used X-rays to measure the angle (in degrees) of deformity in 38 consecutive patients under the age of 21 who came to a medical center for surgery to correct HAV. The angle is a measure of the seriousness of the deformity. Here are the data. 26 22 15 31 16 29 27 32 21 38 23 51 24 27 30 24 19 23 29 27 22 37 28 18 31 14 20 20 19 22 30 17 14 28 31 20 24 It is reasonable to regard these patients as a random sample of young patients who require HAV surgery. Carry out the Solve and Conclude steps of a 95% confidence interval for the mean HAV angle in the population of all such patients. (Round your answer for x to two decimal places and your answer for s to three decimal places. Round your confidence interval bounds to two decimal places.) confidence interval bounds: ° toarrow_forward
- What is the median?arrow_forwardConstruct a normal quantile-quantile plot of the values provided in the accompanying data set, which represent the diameters of 36 rivet heads in 1/100 of an inch. Click the icon to view the diameter data. Choose the correct graph below. A. Normal Quantile-Quantile Plot Normal Quantile-Quantile Plot 5.95- 5.85- 5.75- 5.65- 0.2 0.4 0.6 0.8 1 5.65 5.75 5.85 5.95 Theoretical Quantities Theoretical Quantities D. Normal Quantile-Quantile Plot Normal Quantile-Quantile Plot 5.95- 1- 5.85- 0.5- 5.75- • 000 0- 5.65- -2 5.95 -1 1 5.65 5.75 5.85 Theoretical Quantities Theoretical Quantities Diameter data 5.83 5.77 5.81 5.73 5.73 5.75 5.85 5.84 5.83 5.89 5.71 5.83 5.71 5.81 5.87 5.81 5.84 5.74 5.83 5.84 5.78 5.76 5.71 5.87 5.82 5.78 5.75 5.82 5.89 5.79 Help me solve this View an example Get m 5.71 5.85 5.85 5.78 5.76 5.71 C. Sample Quantities Sample Quantities B. Sample Quantities Sample Quantities ofarrow_forwardResearchers wondered whether the size of a person's brain was related to the individual's mental capacity. They selected a sample of 5 females and 5 males and measured their MRI image pixel counts and IQ scores. Females Males MRI IQ MRI IG The data is reported to the right. Complete parts (a) through (d) below 139 858,472 140 955,003 935,494 924,059 1.079.550 1,001.121 Click the icon to view the critical values table. 991,305 138 141 857,782 833,868 790,619 133 135 132 141 135 140 AMRI 1,080,000- AIO 145 AIO 145- AMRI 1,080,000 780,000 130 130 780,000 130 780,000 780,000 130 1,080,000 145 1,080,000 MRI 145 MRI (b) Compute the linear correlation coefficient between MRI count and IQ. Are MRI count and IQ linearly related? Select the correct choice below and, if necessary, fill in the answer box to complete your choice. (Round to three decimal places as needed.) A. Yes, MRI count and IQ are linearly related since the linear correlation coefficient is O B. No. MRI count and IQ are not…arrow_forward
arrow_back_ios
SEE MORE QUESTIONS
arrow_forward_ios
Recommended textbooks for you
 Algebra and Trigonometry (6th Edition)AlgebraISBN:9780134463216Author:Robert F. BlitzerPublisher:PEARSON
 Contemporary Abstract AlgebraAlgebraISBN:9781305657960Author:Joseph GallianPublisher:Cengage Learning
 Linear Algebra: A Modern IntroductionAlgebraISBN:9781285463247Author:David PoolePublisher:Cengage Learning
 Algebra And Trigonometry (11th Edition)AlgebraISBN:9780135163078Author:Michael SullivanPublisher:PEARSON
 Introduction to Linear Algebra, Fifth EditionAlgebraISBN:9780980232776Author:Gilbert StrangPublisher:Wellesley-Cambridge Press
 College Algebra (Collegiate Math)AlgebraISBN:9780077836344Author:Julie Miller, Donna GerkenPublisher:McGraw-Hill Education

Algebra and Trigonometry (6th Edition)
Algebra
ISBN:9780134463216
Author:Robert F. Blitzer
Publisher:PEARSON

Contemporary Abstract Algebra
Algebra
ISBN:9781305657960
Author:Joseph Gallian
Publisher:Cengage Learning

Linear Algebra: A Modern Introduction
Algebra
ISBN:9781285463247
Author:David Poole
Publisher:Cengage Learning

Algebra And Trigonometry (11th Edition)
Algebra
ISBN:9780135163078
Author:Michael Sullivan
Publisher:PEARSON

Introduction to Linear Algebra, Fifth Edition
Algebra
ISBN:9780980232776
Author:Gilbert Strang
Publisher:Wellesley-Cambridge Press

College Algebra (Collegiate Math)
Algebra
ISBN:9780077836344
Author:Julie Miller, Donna Gerken
Publisher:McGraw-Hill Education