A First Course in Probability (10th Edition)
10th Edition
ISBN: 9780134753119
Author: Sheldon Ross
Publisher: PEARSON
expand_more
expand_more
format_list_bulleted
Question

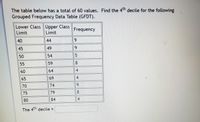
Transcribed Image Text:The table below has a total of 60 values. Find the 4th decile for the following
Grouped Frequency Data Table (GFDT).
Lower Class Upper Class
Frequency
Limit
Limit
40
44
6.
45
49
6.
50
54
5
55
59
60
64
4
65
69
4
70
74
75
79
80
84
4
The 4th decile =
CO
CO
Expert Solution
This question has been solved!
Explore an expertly crafted, step-by-step solution for a thorough understanding of key concepts.
This is a popular solution
Trending nowThis is a popular solution!
Step by stepSolved in 2 steps

Knowledge Booster
Learn more about
Need a deep-dive on the concept behind this application? Look no further. Learn more about this topic, probability and related others by exploring similar questions and additional content below.Similar questions
- The table below has a total of 63 values. Find the 8th decile for the following Grouped Frequency Data Table (GFDT). Lower Class Limit Upper Class Limit Frequency 50 54 8 55 59 6 60 64 5 65 69 5 70 74 7 75 79 7 80 84 8 85 89 4 90 94 13 The 8th decile =arrow_forwardHow do you complete the chart using the above ages ?arrow_forwardSuppose that a histogram is constructed for the frequency distribution shown below.arrow_forward
- MAarrow_forwardA teacher wants to estimate the mean time (in minutes) that students take to go from one classroom to the next. His research assistant uses the sample time of 36 students to report the confidence interval as [8.20, 9.80]. (You may find it useful to reference the t table.) a. Find the sample mean time used to compute the confidence interval. (Round final answer to nearest whole number.) probability= (ANSWER IS NOT 0.005 or 0.1)arrow_forwardUsing the following distribution, answer the questions below: Ages frequency20-25 926-31 732-37 338-43 1144-49 1050-55 8 4) Prepare a frequency polygon to display the data from the exercise abovearrow_forward
- Use the following digits to construct a frequency distribution and then a histogram. Use classes of 0, 1, 2, 3 , 4 , 5 , 6, 7 , 8, 9 (note that each class only contains one value) 000000112333455555555555566888899arrow_forwardSubm Terms of Use I Privacy Cente 2. Household Televisions O 2021 McGraw Hill LLC. All Rights Resenved. 5. 1. 2 0. 1. 1. 2. 2. 0. Household Televisions 2 4. 2 6. 2 4. 0. 14. 96 Thirty households were surveyed for the number of telewisions in each home. Following are the results. Construct a frequency histogram. Continue Scoolarrow_forwardUse the cumulative frequency table on the left(top) to fill in the table on the right.(bottom) Classes Cumulative Frequency Under 10 7 Under 20 19 Under 30 38 Under 40 55 Under 50 60 Classes Frequency Relative Frequency 0-9 10-19 20-29 30-39 40-49arrow_forward
- find the mean, median, and range of the set of numbers. Then, use Excel to create a frequency table and a histogram of the test scores. Make sure to label your tables and graphs appropriately A researcher is studying reaction times in mice. The reaction times in milliseconds (ms) for thirty mice are shown below. 66 384 539 578 166 741 874 384 221 178 176 675 275 15 845 397 271 655 681 702 63 823 364 194 755 744 557 776 69 857arrow_forwardUse the Histogram tool to develop a frequency distribution and histogram for the number of months as a customer of the bank in the data below. Compute the relative and cumulative relative frequencies and use a line chart to construct an ogive. Complete the frequency distribution for the months as a customer, and compute the relative and cumulative relative frequencies. (Type integers or decimals rounded to three decimal places as needed.) Bins Frequency Relative Frequency Cumulative Relative Frequency 10 enter your response here enter your response here enter your response here 20 enter your response here enter your response here enter your response here 30 enter your response here enter your response here enter your response here 40 enter your response here enter your response here enter your response here 50 enter your response here enter your response here enter your…arrow_forwardStrictly homework not quiz thanks!arrow_forward
arrow_back_ios
SEE MORE QUESTIONS
arrow_forward_ios
Recommended textbooks for you
 A First Course in Probability (10th Edition)ProbabilityISBN:9780134753119Author:Sheldon RossPublisher:PEARSON

A First Course in Probability (10th Edition)
Probability
ISBN:9780134753119
Author:Sheldon Ross
Publisher:PEARSON
