
MATLAB: An Introduction with Applications
6th Edition
ISBN: 9781119256830
Author: Amos Gilat
Publisher: John Wiley & Sons Inc
expand_more
expand_more
format_list_bulleted
Related questions
Question
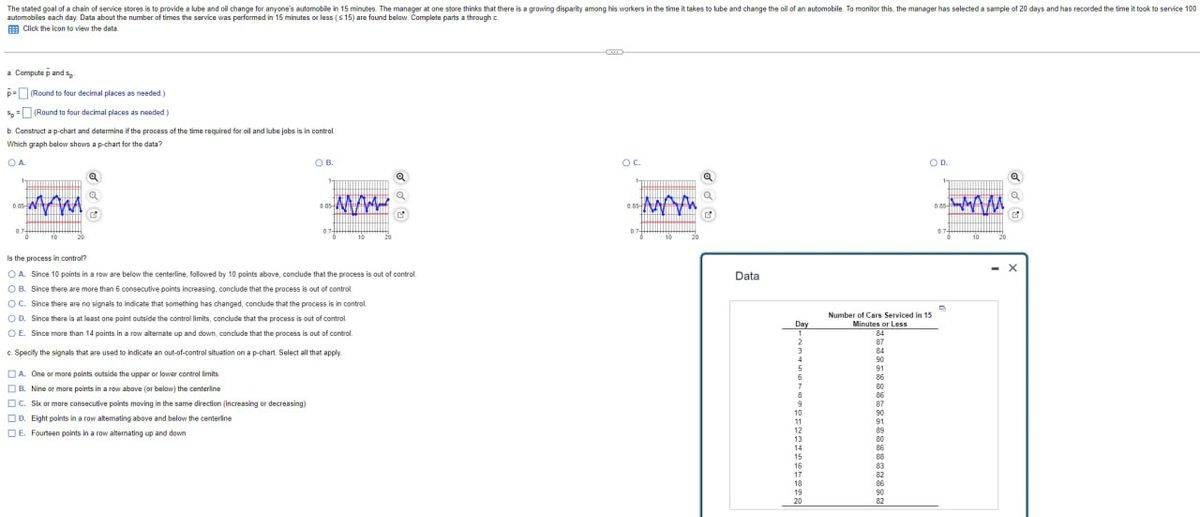

Transcribed Image Text:The stated goal of a chain of service stores is to provide a lube and oil change for anyone's automobile in 15 minutes. The manager at one store thinks that there is a growing disparity among his workers in the time it takes to lube and change the oil of an automobile. To monitor this, the manager has selected a sample of 20 days and has recorded the time it took to service 100
automobiles each day. Data about the number of times the service was performed in 15 minutes or less (515) are found below. Complete parts a through c
Click the icon to view the data.
a. Compute p and sp
p-(Round to four decimal places as needed.)
Sp
(Round to four decimal places as needed)
b. Construct a p-chart and determine if the process of the time required for oil and lube jobs is in control
Which graph below shows a p-chart for the data?
O A.
OB.
Am
0.05
-ww
Is the process in control?
OA. Since 10 points in a row are below the centerline, followed by 10 points above, conclude that the process is out of control.
OB. Since there are more than 6 consecutive points increasing, conclude that the process is out of control.
OC. Since there are no signals to indicate that something has changed, conclude that the process is in control.
OD. Since there is at least one point outside the control limits, conclude that the process is out of control
OE. Since more than 14 points in a row alternate up and down, conclude that the process is out of control.
c. Specify the signals that are used to indicate an out-of-control situation on a p-chart. Select all that apply.
A. One or more points outside the upper or lower control limits
B. Nine or more points in a row above (or below) the centerline
C. Six or more consecutive points moving in the same direction (increasing or decreasing)
D. Eight points in a row altemating above and below the centerline
E. Fourteen points in a row alternating up and down
OC.
www
Data
Number of Cars Serviced in 15
Day
Minutes or Less
84
87
84
90
86
86
87
11
91
12
89
13
14
86
15
88
17
18
19
20
OD.
085-
www
SAVE
AI-Generated Solution
info
AI-generated content may present inaccurate or offensive content that does not represent bartleby’s views.
Unlock instant AI solutions
Tap the button
to generate a solution
to generate a solution
Click the button to generate
a solution
a solution
Knowledge Booster

Similar questions
- Recently, researchers have begun to focus on the relationship between potentially toxic environmental exposures in children to a number of adverse health outcomes. Suppose one such researcher wants to investigate the relationship between lead levels in soil (micrograms/dL) and BMI (kg/m2). The following table represents a SRS of households with the corresponding exterior lead levels and BMI of a randomly sampled child in the home.Leal levels (μg/dL) 13.614.39.79.4 11.4 10.9BMI (kg/m2) 19.719.920.122.1 19.8 21.6A) Write out the null and alternative hypotheses for a formal test of significance testing the correlation between the two variables.B) Calculate a t statistic and interpret your pvalue and results.arrow_forwardThomas wants to compare the mean concentration of carbon monoxide (CO) on residential versus commercial streets, since these differ in terms of car traffic. In each of three neighborhoods of Montréal (named A, B, and C below), he randomly chooses four locations for each type of street, for a total of 24 observations (2 street types x 3 neighborhoods x 4 locations). At each location, he measures CO concentration in the air over a period of 10 hours (8:00 AM-6:00 PM), and obtains the following data (in ppm/h). Question: Test whether or not the difference between residential and commercial streets in mean atmospheric CO concentration is the same among the three neighborhoods, and whether or not CO concentration in the air is the same, on average, for the two types of streets. Note that Neighborhood is considered a random block factor in the ANOVA. Use significant level= 0.05.arrow_forwardSuppose the doctors at a local office take a health survey of 100 adult female patients with similar weight who have had appointments in the last week. According to their medical file, the 100 participants all weigh between 140 – 149 lbs. One of the survey questions asks participants to list their current weight. The accompanying tables show the relative frequency of weights measured by the physician for the 100 participants and the relative frequency of weights recorded in the survey for the 100 participants. Note that some of the weights reported in the survey did not fall between 140 – 149 lbs. Weights reported by physician (to the nearest pound) Weights recorded by participants Weight (in pounds) Relative frequency Weight (in pounds) Relative frequency 140 0.12 140 0.32 141 0.09 141 0.04 142 0.17 142 0.05 143 0.06 143 0.04 144 0.14 144 0.07 145 0.11 145 0.23 146 0.04 146 0.01 147 0.10 147 0.01 148 0.09 148 0.03 149 0.08 149 0.02 Total 1.00 Total 0.82 Select the statements that are…arrow_forward
- Roy's Texaco wants to keep the price of its unleaded gasoline competitive with that of other stations in the area. Roy's is currently charging $1.29 per gallon. To check that the average price for this gasoline for all stations within 12-mile radius is higher than his price, Roy randomly samples the price of unleaded gasoline at ten stations located in this area. He obtains the following data for the price per gallon (in dollars): 1.7, 1.5, 2.6, 2.2, 2.4, 2.3, 2.6, 3.0, 1.4, 2.3 Set up appropriate hypotheses and test them using a significant level of .01.arrow_forwardThe authors of a paper compared two different instruments for measuring a person's capacity for breathing out air. (This measurement is helpful in diagnosing various lung disorders.) The two instruments considered were a Wright peak flow meter and a mini-Wright peak flow meter. Seventeen people participated in the study, and for each person air flow was measured once using the Wright meter and once using the mini-Wright meter. The Wright meter is thought to provide a better measure of air flow, but the mini-Wright meter is easier to transport and to use. Use of the mini-Wright meter could be recommended as long as there is not convincing evidence that the mean reading for the mini-Wright meter is different from the mean reading for Wright meter. For purposes of this exercise, you can assume that it is reasonable to consider the 17 people who participated in this study as representative of the population of interest. Data values from this paper are given in the accompanying table.…arrow_forwardSuppose an oceanographer monitors the daily salinity of a particular ocean in relation to the temperature of the water. The oceanographer plots the data with temperature, in degrees Celsius (°C), along the horizontal axis and salinity, in parts per thousand (ppt), along the vertical axis. Select the true statement about the data point identified by the arrow. An ocean temperature of 21 °C causes the salinity to be 29 ppt. The predicted salinity is 29 ppt when the ocean temperature for the day is 21 °C. An ocean temperature of 29 °C corresponds to a salinity level of 21 ppt. The observed salinity is 29 ppt when the ocean temperature for the day is 21 °C. There is no relationship between the temperature of the ocean on a given day and salinity.arrow_forward
- Researchers were interested in better understanding how autistic children see and understand the world. Participants included children diagnosed with autism and typically- developing children, who were all approximately the same age. All children were presented with several different stimuli on a large computer screen for up to one minute. The stimuli were both social (i.e., people’s faces) and nonsocial (inanimate objects). The percentage of time children spent looking at the two types of stimuli was recorded (ranging from 0 to 100). Consider the graphs shown for a study about blaming the victim. a. What is proper statistical the notation of the design? Use the “__ × __” format. b. Interpret the graphs for the blaming the victim study. For each graph, what are the significant main effects? Is there an interaction? Interpret the main effects and interactions that are present.arrow_forwardYou have been hired to measure the concentration of ammonia in water from wells at two districts on Long Island. After sampling 10 wells in one of the districts you find the values are, in mg/L: 6.4, 2.1, 1.4, 0.7, 6.8, 3.2, 2.7, 1.6, 4.9, 1.2. Your assistant plots the data from the second set of wells and the histogram of data from that sample looks pretty much the same as for your data set. Which statistical test do you anticipate that you will use? An one-sample t-test An unpaired, two-sample t-test A paired, two-sample t-test A one-way anova A Mann-Whitney U test Main Contentarrow_forwardDuring a particularly dry growing season in a southern state, farmers noticed that there is a delicate balance between the number of seeds that are planted per square foot and the yield of the crop in pounds per square foot. The yields were the smallest when the number of seeds per square foot was either very small or very large. The data in the table show various numbers of seeds planted per square foot and yields (in pounds per square foot) for a sample of fields. A 2-column table with 15 rows. Column 1 is labeled number of seeds (per square foot) with entries 28, 75, 30, 43, 71, 35, 40, 59, 66, 79, 85, 81, 16, 33, 16. Column 2 is labeled yield (pounds per square foot) with entries 131, 171, 132, 166, 169, 150, 161, 183, 173, 161, 147, 157, 86, 145, 86. Which scatterplot represents the seed and yield data? A graph titled number of Seeds and Crop Yield has seeds (per square foot) on the x-axis, and yard (pounds per square foot) on the y-axis. The points curve up to a point, and…arrow_forward
- The toco toucan, the largest member of the toucan family, possesses the largest beak relative to body size of all birds. This exaggerated feature has received various interpretations, such as being a refined adaptation for feeding. However, the large surface area may also be an important mechanism for radiating heat (and hence cooling the bird) as outdoor temperature increases. Here are data for beak heat loss, as a percent of total body heat loss from all sources, at various temperatures in degrees Celsius. [Note: The numerical values in this problem have been modified for testing purposes.] Temperature (oC)(oC) 15 16 17 18 19 20 21 22 23 24 25 26 27 28 29 30 Percent heat loss from beak 33 32 33 32 39 43 56 48 44 49 44 56 58 60 60 63 The equation of the least-squares regression line for predicting beak heat loss, as a percent of total body heat loss from all sources, from temperature is: (Use decimal notation. Enter the values of the intercept and slope rounded to two…arrow_forwardYou work as a data scientist for a real estate company in a seaside resort town. Your boss has asked you to discover if it's possible to predict how much a home's distance from the water affects its selling price. You are going to collect a random sample of 7 recently sold homes in your town. You will note the distance each home is from the water (denoted by x, in km) and each home's selling price (denoted by y, in hundreds of thousands of dollars). You will also note the product x.y of the distance from the water and selling price for each home. (These products are written in the row labeled "xy"). (a) Click on "Take Sample" to see the results for your random sample. Distance from the water, .x (in km) Take Sample Selling price, y (in hundreds of thousands of dollars) xy Send data to calculator Based on the data from your sample, enter the indicated values in the column on the left below. Round decimal values to three decimal places. When you are done, select "Compute". (In the table…arrow_forwardA recent experiment included measuring the weight of a package of raw almonds. This type of data would be considered a: Discrete variable or Continuous variable?arrow_forward
arrow_back_ios
SEE MORE QUESTIONS
arrow_forward_ios
Recommended textbooks for you
- MATLAB: An Introduction with ApplicationsStatisticsISBN:9781119256830Author:Amos GilatPublisher:John Wiley & Sons Inc
 Probability and Statistics for Engineering and th...StatisticsISBN:9781305251809Author:Jay L. DevorePublisher:Cengage Learning
 Statistics for The Behavioral Sciences (MindTap C...StatisticsISBN:9781305504912Author:Frederick J Gravetter, Larry B. WallnauPublisher:Cengage Learning
  Elementary Statistics: Picturing the World (7th E...StatisticsISBN:9780134683416Author:Ron Larson, Betsy FarberPublisher:PEARSON
 The Basic Practice of StatisticsStatisticsISBN:9781319042578Author:David S. Moore, William I. Notz, Michael A. FlignerPublisher:W. H. Freeman
 Introduction to the Practice of StatisticsStatisticsISBN:9781319013387Author:David S. Moore, George P. McCabe, Bruce A. CraigPublisher:W. H. Freeman
MATLAB: An Introduction with Applications
Statistics
ISBN:9781119256830
Author:Amos Gilat
Publisher:John Wiley & Sons Inc
Probability and Statistics for Engineering and th...
Statistics
ISBN:9781305251809
Author:Jay L. Devore
Publisher:Cengage Learning
Statistics for The Behavioral Sciences (MindTap C...
Statistics
ISBN:9781305504912
Author:Frederick J Gravetter, Larry B. Wallnau
Publisher:Cengage Learning
Elementary Statistics: Picturing the World (7th E...
Statistics
ISBN:9780134683416
Author:Ron Larson, Betsy Farber
Publisher:PEARSON
The Basic Practice of Statistics
Statistics
ISBN:9781319042578
Author:David S. Moore, William I. Notz, Michael A. Fligner
Publisher:W. H. Freeman
Introduction to the Practice of Statistics
Statistics
ISBN:9781319013387
Author:David S. Moore, George P. McCabe, Bruce A. Craig
Publisher:W. H. Freeman