
Practical Management Science
6th Edition
ISBN: 9781337406659
Author: WINSTON, Wayne L.
Publisher: Cengage,
expand_more
expand_more
format_list_bulleted
Related questions
Question
do fast

Transcribed Image Text:A.
30°
Txy
B
σχ

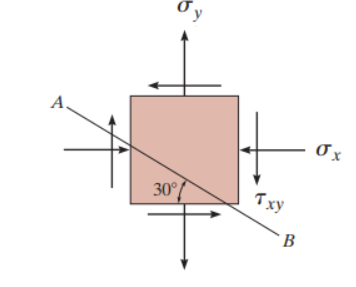
Transcribed Image Text:The state of stress at a point in a member
is shown on the element in (Figure 1).
Solve the problem using the stress
transformation equations. Take ox = 1.8
ksi, oy = 2.0 ksi, τxy = 2.8 ksi in the
directions shown.
Determine the normal stress component
acting on the inclined plane AB
Determine the shear stress component
acting on the inclined plane AB
Expert Solution
This question has been solved!
Explore an expertly crafted, step-by-step solution for a thorough understanding of key concepts.

Step by stepSolved in 2 steps with 4 images

Knowledge Booster

Similar questions
- At the beginning of each week, a machine is in one of four conditions: 1 = excellent; 2 = good; 3 = average; 4 = bad. The weekly revenue earned by a machine in state 1, 2, 3, or 4 is 100, 90, 50, or 10, respectively. After observing the condition of the machine at the beginning of the week, the company has the option, for a cost of 200, of instantaneously replacing the machine with an excellent machine. The quality of the machine deteriorates over time, as shown in the file P10 41.xlsx. Four maintenance policies are under consideration: Policy 1: Never replace a machine. Policy 2: Immediately replace a bad machine. Policy 3: Immediately replace a bad or average machine. Policy 4: Immediately replace a bad, average, or good machine. Simulate each of these policies for 50 weeks (using at least 250 iterations each) to determine the policy that maximizes expected weekly profit. Assume that the machine at the beginning of week 1 is excellent.arrow_forwardCalculate the biaxial stresses σ₁ and σ₂ for the biaxial stress case, where ε₁= 0.002 and ε₂ = - 0.001 are determined experimentally on an aluminum member of elastic constants, E = 71 GPa and v = 0.35 . Also, determine the value for the maximum shear stress.arrow_forwardDetermine the hydraulic flux and the pressure head at the layer interface in a column consisting of a loamysand layer 35 cm thick overlying a sandyloam layer 30 cm thick. The saturated hydraulic conductivities of the loamysand and sandyloam layers are 3.87 cm h-1 and 7.59cm h-1, respectively. Water is ponded at the top of the column to a depth of 5 cm and allowed to drip from the bottom of the column. Use a diagram to represent the flow scenario i will 10ipvotes.arrow_forward
- In hydraulic fracture test, an induced fracture was created at 12.8 MPa. The fracture was reopened in three subsequent cycles. The reopening pressure at third cycle was found to be 6.4 MPa. If the tensile strength of rock is 6.3 MPa, and the pore water pressure is negligible. Determine the maximum and minimum principle stresses if the shut - in pressure was found to be 5.9 MPaarrow_forward1m radius disk is moving on the inclined surface under no slip condition. the center of the disk has 3m/s velocity and according to the figure, bar BC is pinned to the disk at point C and point B always stays on the ground. 1) find angular velocity of BC. 2) find angular acceleration of BCarrow_forwarddo fast.arrow_forward
- Water entering the curved pipe at A is discharged at D. The pipe is rotating about A at the constant angular velocity omega=7 rad/s, and the water has a constant speed of v=19 m/s relative to the pipe. Now fill in the blanks below with correct numbers. Αγω သ B 0.54 m r = 0.18 m The magnitude of acceleration of the water just before it is discharged at D= m/s^2 0.30 marrow_forwarddo fastarrow_forwardT = -25°C A 0.5 m × 1 m double paned window is made of two silica glass panes 1 cm thick, with air in between. Under steady conditions, linear (constant gradient) Outdoors temperature profiles are found in both silica panes, as well as the air. If the room (and the inner surface of h=18Wm²K the inner glass pane) is at a temperature of 25°C, while outdoors it is -25°C with a convection coefficient of 18 W m² K-1, what is the rate of heat loss through the window? What is the rate of heat loss if the room temperature is decreased to 20°C? Finally, what is the rate of heat loss for a room temperature of 25°C, but with one of the panes (and the air) removed? 1 cm 1 cm Room Temperature, 25° C or 20º C 0.5 mm Air, k=0.024 W m¹ K¹ Silica glass, k = 0.90 W m³ Karrow_forward
- BlueMoon Bottlers has a bottle-filling process with a mean value of 64 ounces and a standard deviation of 8 ounces. Suppose the upper and lower specification limits are 71 and 57 ounces, respectively. What is the process capability index of this process? (Note: You MUST show every single step and detailed derivation for full credit)arrow_forwardI need typing clear urjent no chatgpt use i will give 5 upvotes full explanationarrow_forwardThe following data was recorded while observing the increase in the number of butterflies in two different ponds, Pond A and Pond B. Number of Butterflies Present Over 5 Years Year Pond A Pond B 0 50 65 85 1 2 3 4 5 100 O 110 121 133 146 161 110 143 186 What is the rate of growth, r, for each pond and which pond has the fastest average rate of growth over the five years? TA = 1.1, TB = 1.3, mg = 3.72 butterflies/yr TA=0.9, TB=0.8, mg = 3.72 butterflies/yr TA=0.9, TB=0.8, mg=27.2 butterflies/yr TA = 1.1, TB = 1.3, mg=27.2 butterflies/yrarrow_forward
arrow_back_ios
SEE MORE QUESTIONS
arrow_forward_ios
Recommended textbooks for you
- Practical Management ScienceOperations ManagementISBN:9781337406659Author:WINSTON, Wayne L.Publisher:Cengage,
Practical Management Science
Operations Management
ISBN:9781337406659
Author:WINSTON, Wayne L.
Publisher:Cengage,