
MATLAB: An Introduction with Applications
6th Edition
ISBN: 9781119256830
Author: Amos Gilat
Publisher: John Wiley & Sons Inc
expand_more
expand_more
format_list_bulleted
Related questions
Question
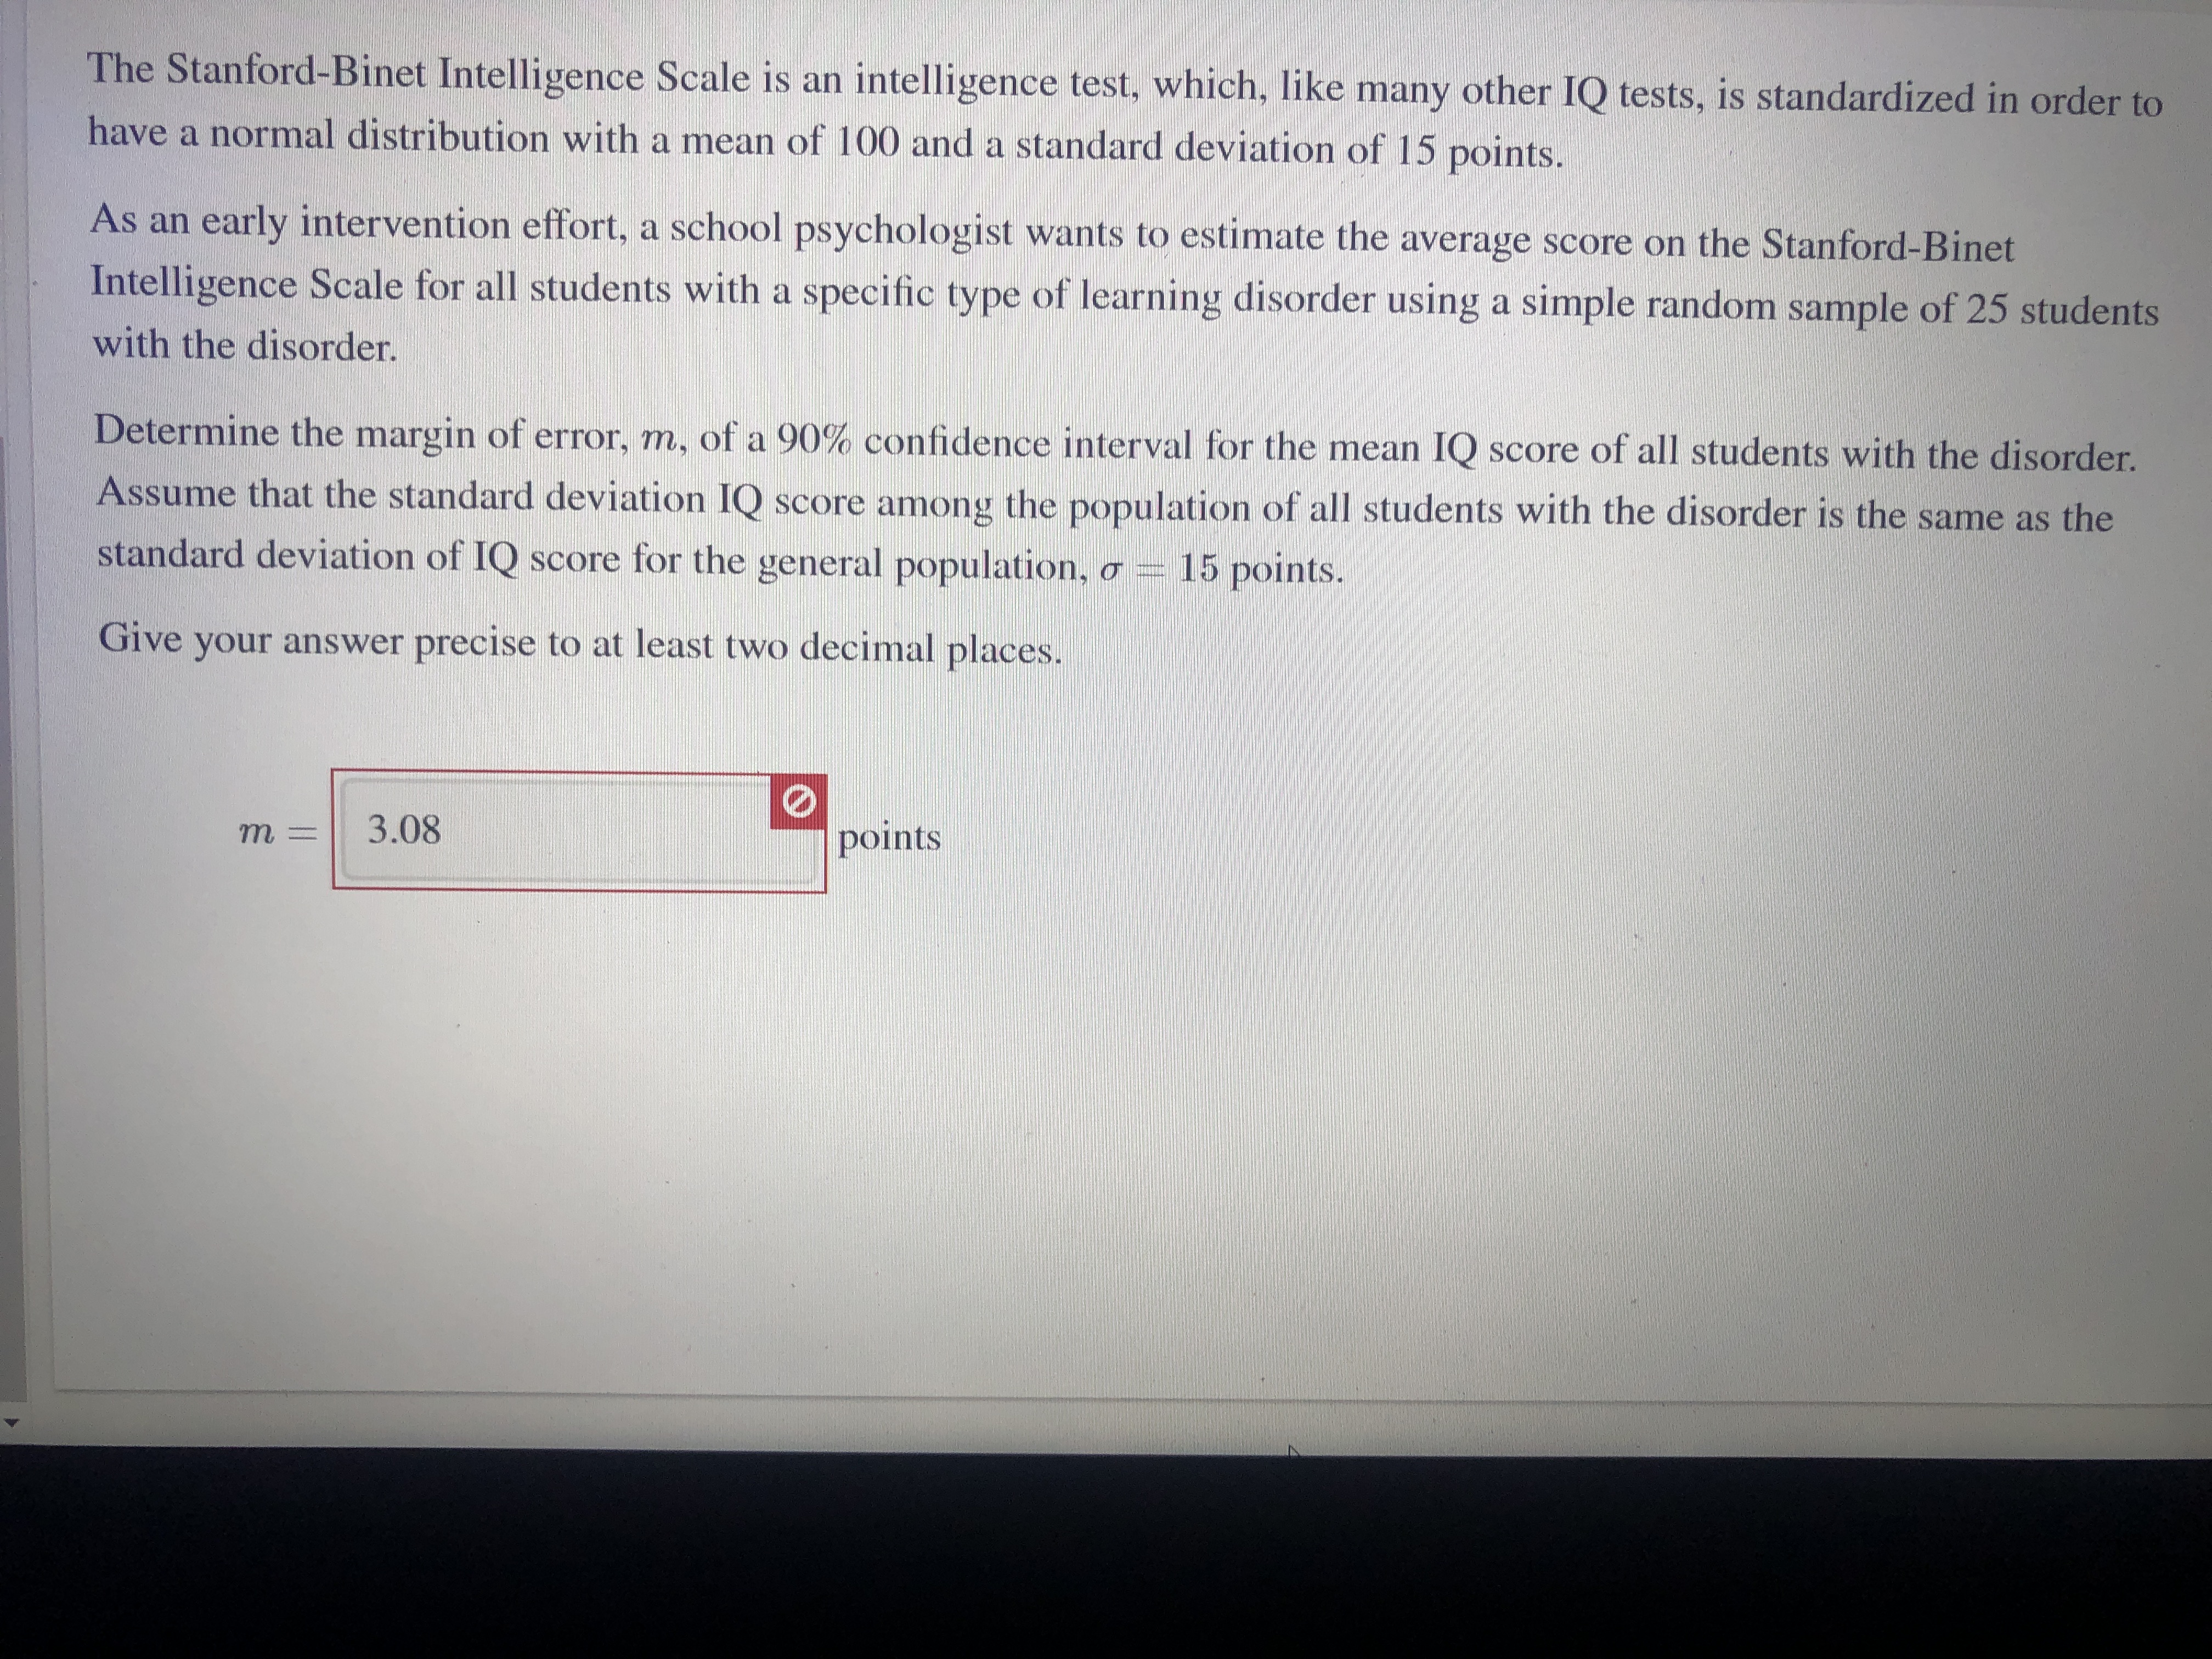

Transcribed Image Text:The Stanford-Binet Intelligence Scale is an intelligence test, which, like many other IQ tests, is standardized in order to
have a normal distribution with a mean of 100 and a standard deviation of 15 points.
As an early intervention effort, a school psychologist wants to estimate the average score on the Stanford-Binet
Intelligence Scale for all students with a specific type of learning disorder using a simple random sample of 25 students
with the disorder.
Determine the margin of error, m, of a 90% confidence interval for the mean IQ score of all students with the disorder.
Assume that the standard deviation IQ score among the population of all students with the disorder is the same as the
standard deviation of IQ score for the general population,
15 points.
Give your answer precise to at least two decimal places.
3.08
points
Expert Solution
This question has been solved!
Explore an expertly crafted, step-by-step solution for a thorough understanding of key concepts.

This is a popular solution

Trending nowThis is a popular solution!

Step by stepSolved in 3 steps with 3 images

Knowledge Booster

Similar questions
- A credit score is used by credit agencies (such as mortgage companies and banks) to assess the creditworthiness of individuals. Values range from 300 to 850, with a credit score over 700 considered to be a quality credit risk. According to a survey, the mean credit score is 704.5. A credit analyst wondered whether high-income individuals (incomes in excess of $100,000 per year) had higher credit scores. He obtained a random sample of 36 high-income individuals and found the sample mean credit score to be 714.9 with a standard deviation of 81.7. Conduct the appropriate test to determine if high-income individuals have higher credit scores at the a = 0.05 level of significance. State the null and alternative hypotheses. Ho: H V H1: H V (Type integers or decimals. Do not round.) Identify the t-statistic. to (Round to two decimal places as needed.) Identify the P-value. P-value = (Round to three decimal places as needed.) Make a conclusion regarding the hypothesis. V the null hypothesis.…arrow_forwardA successful basketball player has a height of 6 feet 11 inches, or 211 cm. Based on statistics from a data set, his height converts to the z score of 5.17. How many standard deviations is his height above the mean?arrow_forwardA credit score is used by credit agencies (such as mortgage companies and banks) to assess the creditworthiness of individuals. Values range from 300 to 850, with a credit score over 700 considered to be a quality credit risk. According to a survey, the mean credit score is 702.4. A credit analyst wondered whether high-income individuals (incomes in excess of $100,000 per year) had higher credit scores. He obtained a random sample of 41 high-income individuals and found the sample mean credit score to be 721.3 with a standard deviation of 80.9. Conduct the appropriate test to determine if high-income individuals have higher credit scores at the a= 0.05 level of significance. State the null and alternative hypotheses. Ho H H₁ H (Type integers or decimals. Do not round.) Identify the t-statistic. to = (Round to two decimal places as needed.) Identify the P-value. P-value= (Round to three decimal places as needed.) Make a conclusion regarding the hypothesis. the null hypothesis. There…arrow_forward
- In the class of 2019, more than 1.6 million students took the SAT. The distribution of scores on the math section (out of 800) is approximately normal with a mean of 528 and standard deviation of 117. What proportion of students earned scores between 500 and 600 on the SAT math test?arrow_forwardA credit score is used by credit agencies (such as mortgage companies and banks) to assess the creditworthiness of individuals. Values range from 300 to 850, with a credit score over 700 considered to be a quality credit risk. According to a survey, the mean credit score is 710.6. A credit analyst wondered whether high-income individuals (incomes in excess of $100,000 per year) had higher credit scores. He obtained a random sample of 48 high-income individuals and found the sample mean credit score to be 723.6 with a standard deviation of 81.2. Conduct the appropriate test to determine if high-income individuals have higher credit scores at the a = 0.10 level of significance. Click the icon to view the table of critical t-values. State the null and alternative hypotheses. Fill in the correct answers below. Ho: Hyi H (Type integers or decimals. Do not round.) Identify the t-statistic. to = (Round to two decimal places as needed.) Approximate the P-value. The P-value is in the range Make…arrow_forwardA credit score is used by credit agencies (such as mortgage companies and banks) to assess the creditworthiness of individuals. Values range from 300 to 850, with a credit score over 700 considered to be a quality credit risk. According to a survey, the mean credit score is 704.9. A credit analyst wondered whether high-income individuals (incomes in excess of $100,000 per year) had higher credit scores. He obtained a random sample of 33 high-income individuals and found the sample mean credit score to be 717.9 with a standard deviation of 83.9. Conduct the appropriate test to determine if high-income individuals have higher credit scores at the g = 0.05 level of significance. State the null and alternative hypotheses. Ho: µ 704.9 H1: µ > 704.9 (Type integers or decimals. Do not round.) Identify the t-statistic, to = (Round to two decimal places as needed.)arrow_forward
- A credit score is used by credit agencies (such as mortgage companies and banks) to assess the creditworthiness of individuals. Values range from 300 to 850, with a credit score over 700 considered to be a quality credit risk. According to a survey, the mean credit score is 708.5. A credit analyst wondered whether high-income individuals (incomes in excess of $100,000 per year) had higher credit scores. He obtained a random sample of 43 high-income individuals and found the sample mean credit score to be 723.3 with a standard deviation of 84.6. Conduct the appropriate test to determine if high-income individuals have higher credit scores at the a = 0.05 level of significance. State the null and alternative hypotheses. Ho: H (Type integers or decimals. Do not round.) Identify the t-statistic. to = (Round to two decimal places as needed.) Identify the P-value. P-value = (Round to three decimal places as needed.) Make a conclusion regarding the hypothesis. the null hypothesis. There…arrow_forwardA credit score is used by credit agencies (such as mortgage companies and banks) to assess the creditworthiness of individuals. Values range from 300 to 850, with a credit score over 700 considered to be a quality credit risk. According to a survey, the mean credit score is 705.8. A credit analyst wondered whether high-income individuals (incomes in excess of $100,000 per year) had higher credit scores. He obtained a random sample of 37 high-income individuals and found the sample mean credit score to be 721.3 with a standard deviation of 81.9. Conduct the appropriate test to determine if high-income individuals have higher credit scores at the a = 0.05 level of significance. State the null and alternative hypotheses. Họ: H H1: H (Type integers or decimals. Do not round.)arrow_forwardA bottled water distributor wants to determine whether the mean amount of water contained in 1-gallon bottles purchased from a nationally known water bottling company is actually 1 gallon. You know from the water bottling company specifications that the standard deviation of the amount of water is 0.02 gallon. You select a random sample of 50 bottles, and the mean amount of water per 1-gallon bottle is 0.992 gallon. What is the test statistic?arrow_forward
arrow_back_ios
arrow_forward_ios
Recommended textbooks for you
- MATLAB: An Introduction with ApplicationsStatisticsISBN:9781119256830Author:Amos GilatPublisher:John Wiley & Sons Inc
 Probability and Statistics for Engineering and th...StatisticsISBN:9781305251809Author:Jay L. DevorePublisher:Cengage Learning
 Statistics for The Behavioral Sciences (MindTap C...StatisticsISBN:9781305504912Author:Frederick J Gravetter, Larry B. WallnauPublisher:Cengage Learning
  Elementary Statistics: Picturing the World (7th E...StatisticsISBN:9780134683416Author:Ron Larson, Betsy FarberPublisher:PEARSON
 The Basic Practice of StatisticsStatisticsISBN:9781319042578Author:David S. Moore, William I. Notz, Michael A. FlignerPublisher:W. H. Freeman
 Introduction to the Practice of StatisticsStatisticsISBN:9781319013387Author:David S. Moore, George P. McCabe, Bruce A. CraigPublisher:W. H. Freeman
MATLAB: An Introduction with Applications
Statistics
ISBN:9781119256830
Author:Amos Gilat
Publisher:John Wiley & Sons Inc
Probability and Statistics for Engineering and th...
Statistics
ISBN:9781305251809
Author:Jay L. Devore
Publisher:Cengage Learning
Statistics for The Behavioral Sciences (MindTap C...
Statistics
ISBN:9781305504912
Author:Frederick J Gravetter, Larry B. Wallnau
Publisher:Cengage Learning
Elementary Statistics: Picturing the World (7th E...
Statistics
ISBN:9780134683416
Author:Ron Larson, Betsy Farber
Publisher:PEARSON
The Basic Practice of Statistics
Statistics
ISBN:9781319042578
Author:David S. Moore, William I. Notz, Michael A. Fligner
Publisher:W. H. Freeman
Introduction to the Practice of Statistics
Statistics
ISBN:9781319013387
Author:David S. Moore, George P. McCabe, Bruce A. Craig
Publisher:W. H. Freeman