
MATLAB: An Introduction with Applications
6th Edition
ISBN: 9781119256830
Author: Amos Gilat
Publisher: John Wiley & Sons Inc
expand_more
expand_more
format_list_bulleted
Related questions
Topic Video
Question
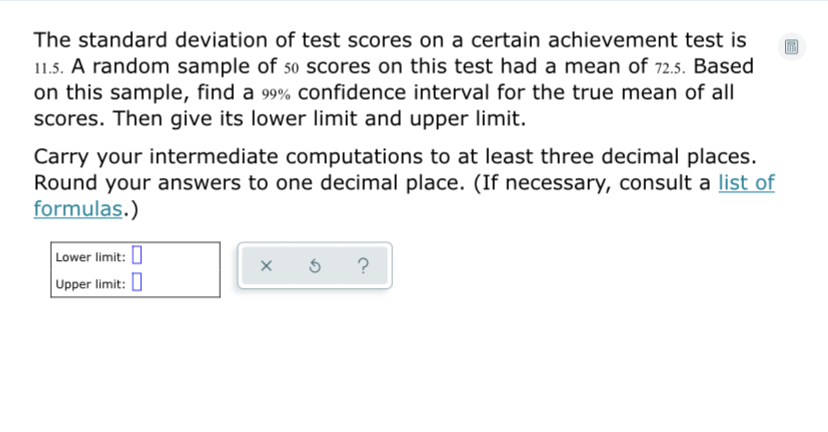

Transcribed Image Text:The standard deviation of test scores on a certain achievement test is
11.5. A random sample of so scores on this test had a mean of 72.5. Based
on this sample, find a 99% confidence interval for the true mean of all
Scores. Then give its lower limit and upper limit.
Carry your intermediate computations to at least three decimal places.
Round your answers to one decimal place. (If necessary, consult a list of
formulas.)
Lower limit: I
?
Upper limit: 0
Expert Solution
This question has been solved!
Explore an expertly crafted, step-by-step solution for a thorough understanding of key concepts.

Step by stepSolved in 3 steps with 2 images

Knowledge Booster


Learn more about
Need a deep-dive on the concept behind this application? Look no further. Learn more about this topic, statistics and related others by exploring similar questions and additional content below.Similar questions
- A random sample of 10,000 bottles of cola was taken to see whether the mean weight was 16 fluid ounces, as marked on the container. The null hypothesis is that the population mean is 16 ounces. Use the read-out below to test the hypothesis that the colas do not have a population mean of 16 fluid ounces. You do not have to do any calculations; just interpret the given data clearly and thoroughly in the context of the problem. | One-Sample T: ounces Test of u = 16 vs = 16 Variable Mean StDev SE Mean 95 CI T P ounces 10000 15.9988 0.0985 0.0010 (15.9969, 16.0007) -1.21 0.225arrow_forwardFind the score that 75% of students will exceed. Consider the NAEP scores which are approximately normal N(288,38). 75% of the students will score above x on this exam. Find x.arrow_forwardYou measure 46 turtles' weights, and find they have a mean weight of 36 ounces. Assume the population standard deviation is 3.4 ounces. Based on this, construct a 80% confidence interval for the true population mean turtle weight.Give your answers as decimals, to two places ¯x ± M.O.E._________ ± ________ouncesarrow_forward
- Out of 400 people sampled, 60 had kids. Based on this, construct a 90% confidence interval for the true population proportion of people with kids.Give your answers as decimals, to three places.______ < p < __________arrow_forwardWe have a population of frogs with a mean weight of 0.9 pounds. We select four frogs and find their average weight. What do you suppose it will be?arrow_forwardA sample of 30 commuters in the area of a certain city yielded the accompanying commute times, in minutes. Preliminary data analyses indicate that the t-interval procedu interval for the mean commute time of all commuters in the area of the city. (Note: x= 27.47 minutes and s 9.81 minutes.) Click here to view the commute times. Click here to view page 1 of the t-table. Click here to view page 2 of the t-table. an reasonably be applied. Find and interpret a 99% confidence ..... The 99% confidence interval is from minute(s) to minute(s). (Round to one decimal place as needed.) Commute times 22 28 33 26 42 29 27 36 25 14 47 39 32 15 18 11 21 17 30 26 15 21 28 17 29 46 18 36 36 40 Print Done Clear all Check answer View an example Get more help - Help me solve this NOV W 3,769 étv 23 280 MacBook Air DII F11 F12 吕口 888 F10 • F7 F8 F9 F5 F6 F4 esc F2 F3 F1 & %23 %24 dele 7 8 9- 2 4. E R Y. 会 w/arrow_forward
- Alpha is usually set at .05 but it does not have to be; this is the decision of the statistician. Alpha is usually set at .05 but it does not have to be; this is the decision of the statistician. True Falsearrow_forwardIf n=25, ¯xx¯(x-bar)=47, and s=3, find the margin of error at a 80% confidence levelGive your answer to two decimal places. ________________arrow_forwardAssume that the readings at freezing on a batch of thermometers are normally distributed with a mean of 0°C and a standard deviation of 1.00°C. A single thermometer is randomly selected and tested. Find P70, the 70-percentile. This is the temperature reading separating the bottom 70% from the top 30%.P70 = °C(Round answer to three decimal places)arrow_forward
arrow_back_ios
arrow_forward_ios
Recommended textbooks for you
- MATLAB: An Introduction with ApplicationsStatisticsISBN:9781119256830Author:Amos GilatPublisher:John Wiley & Sons Inc
 Probability and Statistics for Engineering and th...StatisticsISBN:9781305251809Author:Jay L. DevorePublisher:Cengage Learning
 Statistics for The Behavioral Sciences (MindTap C...StatisticsISBN:9781305504912Author:Frederick J Gravetter, Larry B. WallnauPublisher:Cengage Learning
  Elementary Statistics: Picturing the World (7th E...StatisticsISBN:9780134683416Author:Ron Larson, Betsy FarberPublisher:PEARSON
 The Basic Practice of StatisticsStatisticsISBN:9781319042578Author:David S. Moore, William I. Notz, Michael A. FlignerPublisher:W. H. Freeman
 Introduction to the Practice of StatisticsStatisticsISBN:9781319013387Author:David S. Moore, George P. McCabe, Bruce A. CraigPublisher:W. H. Freeman
MATLAB: An Introduction with Applications
Statistics
ISBN:9781119256830
Author:Amos Gilat
Publisher:John Wiley & Sons Inc
Probability and Statistics for Engineering and th...
Statistics
ISBN:9781305251809
Author:Jay L. Devore
Publisher:Cengage Learning
Statistics for The Behavioral Sciences (MindTap C...
Statistics
ISBN:9781305504912
Author:Frederick J Gravetter, Larry B. Wallnau
Publisher:Cengage Learning
Elementary Statistics: Picturing the World (7th E...
Statistics
ISBN:9780134683416
Author:Ron Larson, Betsy Farber
Publisher:PEARSON
The Basic Practice of Statistics
Statistics
ISBN:9781319042578
Author:David S. Moore, William I. Notz, Michael A. Fligner
Publisher:W. H. Freeman
Introduction to the Practice of Statistics
Statistics
ISBN:9781319013387
Author:David S. Moore, George P. McCabe, Bruce A. Craig
Publisher:W. H. Freeman