Introductory Circuit Analysis (13th Edition)
13th Edition
ISBN: 9780133923605
Author: Robert L. Boylestad
Publisher: PEARSON
expand_more
expand_more
format_list_bulleted
Question

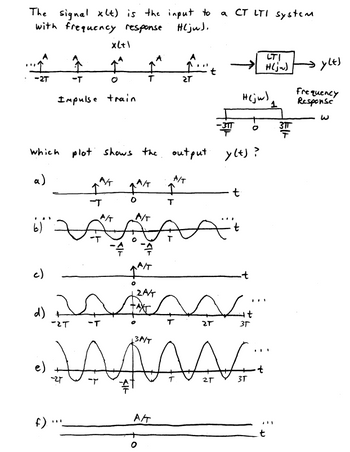
Transcribed Image Text:The image presents a signal processing problem involving a continuous-time (CT) linear time-invariant (LTI) system. The problem involves determining which plot correctly represents the output signal \( y(t) \).
### Description:
1. **Input Signal \( x(t) \):**
- The input is depicted as an impulse train with impulses located at \(-2T, -T, 0, T, 2T, \ldots\).
- Each impulse has an amplitude of \( A \).
2. **System Characteristics:**
- The system is described as a CT LTI system with a frequency response \( H(j\omega) \).
- The frequency response is a rectangular function centered around zero frequency, spanning from \(-\frac{3\pi}{T}\) to \(\frac{3\pi}{T}\).
3. **Diagram:**
- **Block Diagram:** Shows \( x(t) \) as input to the LTI system with the output as \( y(t) \).
### Task:
- Determine which plot (a) to (f) represents the output \( y(t) \).
### Plots:
- **a)** An impulse train with impulses at \(-T, 0, T, \ldots\) and amplitude \(\frac{A}{T}\).
- **b)** A continuous waveform oscillating sinusoidally between \(-\frac{A}{T}\) and \(\frac{A}{T}\), zero at intervals of \(T\).
- **c)** An impulse train similar to (a) but starting from \(0\).
- **d)** A sinusoidal waveform with higher frequency and amplitude spikes at integer multiples of \(T\).
- **e)** Another sinusoidal waveform, oscillating between \(-\frac{A}{T}\) and \(\frac{A}{T}\), showing three cycles over one interval.
- **f)** A constant line at amplitude \(\frac{A}{T}\).
### Graphical Explanation:
- The frequency response \( H(j\omega) \) indicates that the system acts as a low-pass filter, allowing frequencies contained within the range of \(-\frac{3\pi}{T}\) to \(\frac{3\pi}{T}\).
- The choice of the correct output plot \( y(t) \) will depend on the filtering effect on the spectral components of \( x
Expert Solution
This question has been solved!
Explore an expertly crafted, step-by-step solution for a thorough understanding of key concepts.
Step by stepSolved in 3 steps with 2 images

Knowledge Booster
Learn more about
Need a deep-dive on the concept behind this application? Look no further. Learn more about this topic, electrical-engineering and related others by exploring similar questions and additional content below.Similar questions
- I really need help solving this question, please be precise. Will rate. Question: A random variable X has the follwoing PDF: * See image What is the probability that X > 1?arrow_forward0.5 -6 -2 4. 6. time in seconds What, signal is plotted above? O Type here to search %23 76°F A OE O 0 deete home backspack 80 QWE Rarrow_forwardFrom (d) to (h) pleasearrow_forward
Recommended textbooks for you
 Introductory Circuit Analysis (13th Edition)Electrical EngineeringISBN:9780133923605Author:Robert L. BoylestadPublisher:PEARSON
 Delmar's Standard Textbook Of ElectricityElectrical EngineeringISBN:9781337900348Author:Stephen L. HermanPublisher:Cengage Learning
 Programmable Logic ControllersElectrical EngineeringISBN:9780073373843Author:Frank D. PetruzellaPublisher:McGraw-Hill Education
 Fundamentals of Electric CircuitsElectrical EngineeringISBN:9780078028229Author:Charles K Alexander, Matthew SadikuPublisher:McGraw-Hill Education
 Electric Circuits. (11th Edition)Electrical EngineeringISBN:9780134746968Author:James W. Nilsson, Susan RiedelPublisher:PEARSON
 Engineering ElectromagneticsElectrical EngineeringISBN:9780078028151Author:Hayt, William H. (william Hart), Jr, BUCK, John A.Publisher:Mcgraw-hill Education,

Introductory Circuit Analysis (13th Edition)
Electrical Engineering
ISBN:9780133923605
Author:Robert L. Boylestad
Publisher:PEARSON

Delmar's Standard Textbook Of Electricity
Electrical Engineering
ISBN:9781337900348
Author:Stephen L. Herman
Publisher:Cengage Learning

Programmable Logic Controllers
Electrical Engineering
ISBN:9780073373843
Author:Frank D. Petruzella
Publisher:McGraw-Hill Education

Fundamentals of Electric Circuits
Electrical Engineering
ISBN:9780078028229
Author:Charles K Alexander, Matthew Sadiku
Publisher:McGraw-Hill Education

Electric Circuits. (11th Edition)
Electrical Engineering
ISBN:9780134746968
Author:James W. Nilsson, Susan Riedel
Publisher:PEARSON

Engineering Electromagnetics
Electrical Engineering
ISBN:9780078028151
Author:Hayt, William H. (william Hart), Jr, BUCK, John A.
Publisher:Mcgraw-hill Education,