MATLAB: An Introduction with Applications
6th Edition
ISBN: 9781119256830
Author: Amos Gilat
Publisher: John Wiley & Sons Inc
expand_more
expand_more
format_list_bulleted
Question

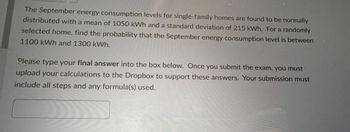
Transcribed Image Text:The September energy consumption levels for single-family homes are found to be normally
distributed with a mean of 1050 kWh and a standard deviation of 215 kWh. For a randomly
selected home, find the probability that the September energy consumption level is between
1100 kWh and 1300 kWh.
Please type your final answer into the box below. Once you submit the exam, you must
upload your calculations to the Dropbox to support these answers. Your submission must
include all steps and any formula(s) used.
SAVE
AI-Generated Solution
info
AI-generated content may present inaccurate or offensive content that does not represent bartleby’s views.
Unlock instant AI solutions
Tap the button
to generate a solution
to generate a solution
Click the button to generate
a solution
a solution
Knowledge Booster
Similar questions
- The amount of snowfall falling in a certain mountain range is normally distributed with a mean of 80 inches,, and a standard deviation of 10 inches. What is the probability that the men annual snowfall during 25 randomly picked years will exceed 82.8 inches? Draw a picture. Show z calculation. Use Table A-2.arrow_forwardThe average length of one month old infants is 21. 52 inches with the standard deviation of one. 02 at his one month check up Kyle measures in the 25. 47 percentile how long is Kyle.arrow_forwardA study group takes a practice statistics exam. They find that the group has a mean score of 80 with a Standard Deviation of 5. Lily has a z-score of 1.9 and wants to know her raw score. Calculate her score. the answer is Between 89.4 and 89.6 can you please show me the work, how do I find her score?arrow_forward
- A study reported that the mean concentration of ammonium in water wells in the state of Iowa was 0.71 milligram per liter, and the standard deviation was 1.09 milligrams per liter. Is it possible to determine whether these concentrations are approximately normally distributed. If so, say whether they are normally distributed, and explain how you know. If not, describe the additional information you would need to determine whether they are normally distributed.arrow_forwardMs. Gonzalez has recorded the test scores for each of her 25 students, She has calculated EX? = 320 and (EX) = 5,000, Calculate the estimated population standard deviation for her data. 1.98 2.24 O 5.00 O 3.95arrow_forwardAssume that adults have IQ scores that are normally distributed with a mean of u = 105 and a standard deviation a = 15. Find the probability that a randomly selected adult has an IQ between 91 and 119. Click to view page 1 of the table. Click to view page 2 of the table. The probability that a randomly selected adult has an IQ between 91 and 119 is. (Type an integer or decimal rounded to four decimal places as needed.) Enter your answer in the answer box. MacBook Air esc 888 %23 & 2 3 4 5 6 7 8 Q E R T Y tab P A D G H caps lock K V в N M > ? control option command command optionarrow_forward
- Students must have GPAs in the top 7.5% of the school to be accepted into the honour society. When the average GPA is 2.92 with the standard deviation of 0.29, what GPA do you have to have to be accepted? Show all your work. Round off to 100th.arrow_forwardPlease awnser following question 2. An overbearing mother recorded the number of minutes her daughter spentexercising over 4 days. Here are the number of minutes per day:2, 9, 14, 15a. Write out the formula for: mean of xb. Use the formula to evaluate mean of x, by plugging in the values and manually carrying outthe calculation.c. Write out the formula for standard deviation. Please solve a, b and carrow_forwardThe distances golf balls travel under laboratory testing conditions are normally distributed. The mean is 312 yards. The probability the golf ball travels further than 319 yards is 0.28. Find the probability a randomly selected golf ball travels between 305 yards and 319 yards. Express the answer as a decimal value rounded to the nearest hundredth.arrow_forward
arrow_back_ios
arrow_forward_ios
Recommended textbooks for you
 MATLAB: An Introduction with ApplicationsStatisticsISBN:9781119256830Author:Amos GilatPublisher:John Wiley & Sons Inc
 Probability and Statistics for Engineering and th...StatisticsISBN:9781305251809Author:Jay L. DevorePublisher:Cengage Learning
 Statistics for The Behavioral Sciences (MindTap C...StatisticsISBN:9781305504912Author:Frederick J Gravetter, Larry B. WallnauPublisher:Cengage Learning
 Elementary Statistics: Picturing the World (7th E...StatisticsISBN:9780134683416Author:Ron Larson, Betsy FarberPublisher:PEARSON
 The Basic Practice of StatisticsStatisticsISBN:9781319042578Author:David S. Moore, William I. Notz, Michael A. FlignerPublisher:W. H. Freeman
 Introduction to the Practice of StatisticsStatisticsISBN:9781319013387Author:David S. Moore, George P. McCabe, Bruce A. CraigPublisher:W. H. Freeman

MATLAB: An Introduction with Applications
Statistics
ISBN:9781119256830
Author:Amos Gilat
Publisher:John Wiley & Sons Inc

Probability and Statistics for Engineering and th...
Statistics
ISBN:9781305251809
Author:Jay L. Devore
Publisher:Cengage Learning

Statistics for The Behavioral Sciences (MindTap C...
Statistics
ISBN:9781305504912
Author:Frederick J Gravetter, Larry B. Wallnau
Publisher:Cengage Learning

Elementary Statistics: Picturing the World (7th E...
Statistics
ISBN:9780134683416
Author:Ron Larson, Betsy Farber
Publisher:PEARSON

The Basic Practice of Statistics
Statistics
ISBN:9781319042578
Author:David S. Moore, William I. Notz, Michael A. Fligner
Publisher:W. H. Freeman

Introduction to the Practice of Statistics
Statistics
ISBN:9781319013387
Author:David S. Moore, George P. McCabe, Bruce A. Craig
Publisher:W. H. Freeman