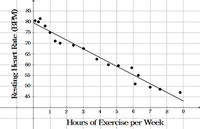
The
Choose the best interpretation of the slope in the context for this example.
Question 3 options:
|
|
For every hour of exercise per week, a person’s resting heart rate decreases by four beats per minute. |
|
|
For every hour of exercise per week, a person’s resting heart rate increases by four beats per minute. |
|
|
For every four hours of exercise per week, a person’s resting heart rate increases by one beat per minute.
|
|
|
For every eighty hours of exercise per week, a person’s resting heart rate decreases by four beats per minute. |
|
|
For every four hours of exercise per week, a person’s resting heart rate increases by eighty beats per minute. |

Trending nowThis is a popular solution!
Step by stepSolved in 2 steps

- Find the slope using this table: y ary -6 10 -3 es 3. 4 Education 6 2. 6. 2/3 1/2 의arrow_forwardHow do I find the Point Slope?arrow_forwardThe least-squares regression equation is y = 649.1x + 16,025 where y is the median income and x is the percentage of 25 years and older with at least a bachelor's degree in the region. The scatter diagram indicates a linear relation between the two variables with a correlation coefficient of 0.7324. Complete parts (a) through (d). C This is (Round to the nearest dollar as needed.) than expected because the expected income is $ 55000- 20000- (a) Predict the median income of a region in which 25% of adults 25 years and older have at least a bachelor's degree. $ (Round to the nearest dollar as needed.) (b) In a particular region, 25.4 percent of adults 25 years and older have at least a bachelor's degree. The median income in this region is $35,740. Is this income higher than wh you would expect? Why? 15 20 25 30 35 40 45 50 55 60 Bachelor's % (c) Interpret the slope. Select the correct choice below and fill in the answer box to complete your choice. (Type an integer or decimal. Do not…arrow_forward
- 2. A.3(B) Find the slope of the graph. Step 1: Plot 2 points on the line. Step 2: slope = m = Answer: rise run = -Xarrow_forwardThere is a proportional relationship between minutes and dollars per minute, shown on a graph of printing expenses. The graph passes through the point (1, 4.40). What is the slope of the graph? What is the unit rate? Complete the explanation. The slope is [blank]. The unit rate is $[blank]/min. If the graph of a proportional relationship passes through the point ([blank, r), then r equals the slope and unit rate.arrow_forwardIdentify the slope and the trend of the line that passes through the following points.arrow_forward
- Does this have a slope of 0?arrow_forwardTeen Birth Rate The birth rate in 2013 for U.S. girlsages 15 to 19 was the lowest since the governmentbegan tracking the statistic in 1940. The highest birthrate for U.S. teens was 96.3 per 1000 girls in 1957.In 2013, the birth rate was lowest at 26.3. Let x equalthe number of years after 1950.a. What is the slope of the line joining the points(7, 96.3) and (63, 26.3)?b. What is the average rate of change in the birth rateover this period?c. What does this average rate of change tell aboutthe birth rate?d. Use the slope from part (a) and the birth rate from2013 to write the equation of the line. Let x represent the number of years after 1950.(Source: Centers for Disease Control and Prevention)arrow_forwardThe graph below represents a CÉF curve of 3 different treatments. What is the slope of the line between points Cand Hif the ICER for treatments C and H is $10/year? 3- A 100 200 300 $ (thousands) de Years ICERCA = $60k / yeararrow_forward
- The table and scatter plot show the time spent studying, x, and the midterm score, y, for each of 10 students. The equation of the line of best fit is y = 4.2x+11.58. Time spent Midterm 100- studying, x (in hours) score, y 90 3.3 21.51 4.0 28.04 Midterm score 60 Xx 4.8 22.89 50- 5.7 36.06 40- 6.9 36.28 30- 20- 8.2 58.20 104 8.5 45.42 14 10 12 14 16 18 20 22 24 12 9.1 56.72 12.1 70.00 Time spent studying (in hours) 15.0 74.58 Use the equation of the line of best fit to fill in the blanks below. Give exact answers, not rounded approximations. Time spent studying (in hours) Observed midterm Predicted midterm Residual Score Score 12.1 15.0arrow_forwardThe slope of a line is: 2.00 By how much does the Y-variable change if the X-variable decreases by 1 unit?arrow_forwardWhat's the answerarrow_forward
 Algebra and Trigonometry (6th Edition)AlgebraISBN:9780134463216Author:Robert F. BlitzerPublisher:PEARSON
 Contemporary Abstract AlgebraAlgebraISBN:9781305657960Author:Joseph GallianPublisher:Cengage Learning
 Linear Algebra: A Modern IntroductionAlgebraISBN:9781285463247Author:David PoolePublisher:Cengage Learning
 Algebra And Trigonometry (11th Edition)AlgebraISBN:9780135163078Author:Michael SullivanPublisher:PEARSON
 Introduction to Linear Algebra, Fifth EditionAlgebraISBN:9780980232776Author:Gilbert StrangPublisher:Wellesley-Cambridge Press
 College Algebra (Collegiate Math)AlgebraISBN:9780077836344Author:Julie Miller, Donna GerkenPublisher:McGraw-Hill Education


