
Advanced Engineering Mathematics
10th Edition
ISBN: 9780470458365
Author: Erwin Kreyszig
Publisher: Wiley, John & Sons, Incorporated
expand_more
expand_more
format_list_bulleted
Related questions
Question
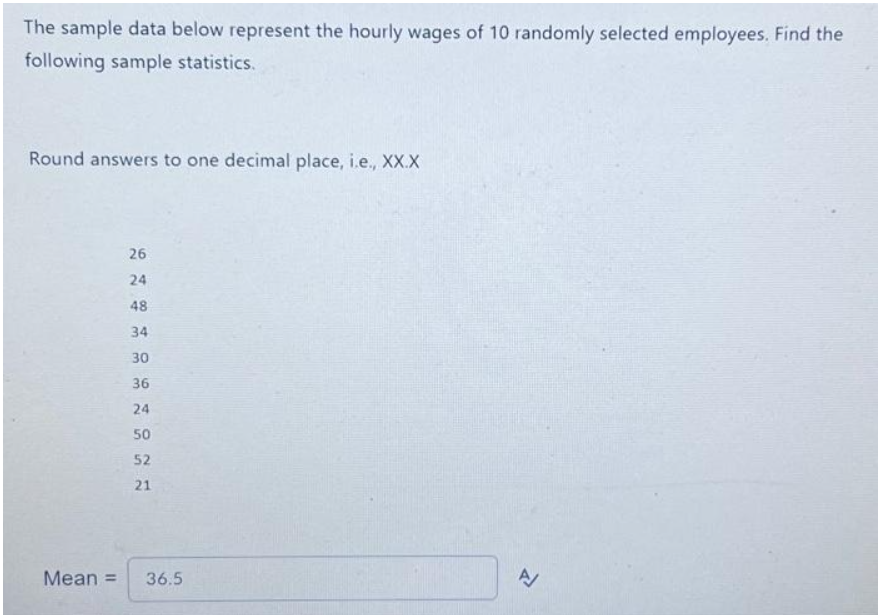

Transcribed Image Text:The sample data below represent the hourly wages of 10 randomly selected employees. Find the
following sample statistics.
Round answers to one decimal place, i.e., XX.X
26
24
48
34
30
36
24
50
52
21
Mean = 36.5
A/
Expert Solution
This question has been solved!
Explore an expertly crafted, step-by-step solution for a thorough understanding of key concepts.

Step by stepSolved in 3 steps with 2 images

Knowledge Booster

Similar questions
- Find the missing weight in the following data set: Person 1 2 3 4 weight 139 150 181 X Deviation from the Mean -21.5 -10.5 20.5 11.5arrow_forwardFind the percentile of the sample data 20 and 37.arrow_forwardListed to the right are the selling prices (in thousands of dollars) for a sample of 19 lakeside lots in Pinnacle Peak, a vacation home community in the Blue Ridge mountains. 86 61 148 81 39 142 140 65 28 85 90 92 25 50 85 85 82 120 137 Determine the following: a. the first quartile b. the third quartile c. the medianarrow_forward
- These data are the number of on-campus burglaries reported in a given year for nine western Pennsylvania universities. 16 10 4 16 9 8 12 5 16 For the above data set, find the mean, median, midrange, and mode. Round to one decimal place, if necessary.arrow_forwardThe table below shows the scores of a group of students on a 10-point quiz. Test Score Frequency 3 1 4 1 7 4 8 4 9. 10 2 The mean score on this test is: The median score on this test is: Check Answerarrow_forwardThe following data shows the results for 20 students in one of the post graduate unit.42 66 67 71 78 62 61 76 71 6761 64 61 54 83 63 68 69 81 53Based on the information given you are required to Compute the mean, median and mode.arrow_forward
- Find the mode for the scores in the following frequency distribution table: Number Frequency Cumulative Frequency 53 18 52 17 51 14 50 12 49 7 47 3arrow_forwardGiven the following data set that presents 30 test scores on an exam, find the position of median. State your result/answer as a value with exactly one digit after the decimal 49.5, 48, 51, 50, 53.2, 52, 55, 54, 57, 56, 59, 58, 61, 60, 63, 62, 65.4, 64, 67.5, 66, 69, 68, 71, 70, 73, 72, 75.2, 74, 92, 88arrow_forwardFind the (a) mean, (b) median, (c) mode, and (d) midrange for the data and then (e) answer the given question. Listed below are the jersey numbers of 11 players randomly selected from the roster of a championship sports team. What do the results tell us? 15 26 89 80 37 83 73 72 32 78 70 D a. Find the mean. The mean is 59.5. (Type an integer or a decimal rounded to one decimal place as needed.) b. Find the median. The median is 72. (Type an integer or a decimal rounded to one decimal place as needed.) c. Find the mode. Select the correct choice below and, if necessary, fill in the answer box to complete your choice. OA. The mode(s) is (are) (Type an integer or a decimal. Do not round. Use a comma to separate answers as needed.) B. There is no mode. d. Find the midrange. The midrange is 52. (Type an integer or a decimal rounded to one decimal place as needed.) e. What do the results tell us? OA. The midrange gives the average (or typical) jersey number, while the mean and median give two…arrow_forward
- The table below shows the scores of a group of students on a 10-point quiz. Test Score Frequency 3 4 4 2 5 2 6 3 7 1 8 4 9 2 10 1 The mean score on this test is: IncorrectThe median score on this test is: Show your workarrow_forwardMs. Lorraine Finch, a fifth grade teacher has a large class of 50 students for the 2018 - 2019 school year. After giving a reading comprehension test, Ms. Finch decided to do a brief statistical analysis. A frequency distribution of the results is presented below. a. Fill in the missing pa rts of Ms. Finch’s frequency distribution. Do any necessary scrap work in the space next to the table. b. Construct a histogram of the frequency distribution. c Is the distribution of test scores normal? Explain. Score Frequency Relative Frequency 84 2 0.04 85 5 0.1 86 0.08 87 8 0.16 88 10 89 90 5 0.1 91 4 0.08 92 3 0.06arrow_forward
arrow_back_ios
arrow_forward_ios
Recommended textbooks for you
- Advanced Engineering MathematicsAdvanced MathISBN:9780470458365Author:Erwin KreyszigPublisher:Wiley, John & Sons, Incorporated
 Numerical Methods for EngineersAdvanced MathISBN:9780073397924Author:Steven C. Chapra Dr., Raymond P. CanalePublisher:McGraw-Hill Education
 Introductory Mathematics for Engineering Applicat...Advanced MathISBN:9781118141809Author:Nathan KlingbeilPublisher:WILEY
  Mathematics For Machine TechnologyAdvanced MathISBN:9781337798310Author:Peterson, John.Publisher:Cengage Learning,

Advanced Engineering Mathematics
Advanced Math
ISBN:9780470458365
Author:Erwin Kreyszig
Publisher:Wiley, John & Sons, Incorporated
Numerical Methods for Engineers
Advanced Math
ISBN:9780073397924
Author:Steven C. Chapra Dr., Raymond P. Canale
Publisher:McGraw-Hill Education
Introductory Mathematics for Engineering Applicat...
Advanced Math
ISBN:9781118141809
Author:Nathan Klingbeil
Publisher:WILEY
Mathematics For Machine Technology
Advanced Math
ISBN:9781337798310
Author:Peterson, John.
Publisher:Cengage Learning,