MATLAB: An Introduction with Applications
6th Edition
ISBN: 9781119256830
Author: Amos Gilat
Publisher: John Wiley & Sons Inc
expand_more
expand_more
format_list_bulleted
Question

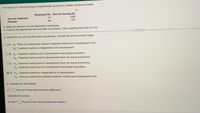
Transcribed Image Text:The results of a trial involving an experimental vaccine for children are shown below.
Developed flu Did not develop flu
14
1056
Vaccine treatment
Placebo
95
437
a. State the relevant null and alternative hypotheses.
b. Conduct the appropriate test and state a conclusion. Use a significance level of 0.10.
a. Determine the null and alternative hypotheses. Choose the correct answer below.
O A. Hn: There is a relationship between treatment method and development of flu.
HA: Treatment method is independent of flu development.
O B. Ho: Treatment method and flu development have equal proportions.
HA: Treatment method and flu development have non-equal proportions.
OC. Ho: Treatment method and flu development have non-equal proportions.
HA: Treatment method and flu development have equal proportions.
O D. Ho: Treatment method is independent of flu development.
HA: There is a relationship between treatment method and development of flu.
b. Calculate the test statistic.
(Round to three decimal places as needed.)
Calculate the p-value.
p-value =
(Round to four decimal places as needed.)

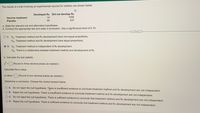
Transcribed Image Text:The results of a trial involving an experimental vaccine for children are shown below.
Developed flu Did not develop flu
1056
Vaccine treatment
14
Placebo
95
437
a. State the relevant null and alternative hypotheses.
b. Conduct the appropriate test and state a conclusion. Use a significance level of 0.10.
.....
OC. Ho: Treatment method and flu development have non-equal proportions.
HA: Treatment method and flu development have equal proportions.
O D. Ho: Treatment method is independent of flu development.
HA: There is a relationship between treatment method and development of flu.
b. Calculate the test statistic.
x = (Round to three decimal places as needed.)
Calculate the p-value.
p-value = (Round to four decimal places as needed.)
Determine a conclusion. Choose the correct answer below.
O A. Do not reject the null hypothesis. Titere is insufficient evidence to conclude treatment method and flu development are not independent.
O B. Reject the null hypothesis. There is insufficient evidence to conclude treatment method and flu development are not independent.
OC. Do not reject the null hypothesis. There is sufficient evidence to conclude that treatment method and flu development are not independent.
D. Reject the null hypothesis. There is sufficient evidence to conclude that treatment method and flu development are not independent.
Expert Solution
This question has been solved!
Explore an expertly crafted, step-by-step solution for a thorough understanding of key concepts.
This is a popular solution
Trending nowThis is a popular solution!
Step by stepSolved in 2 steps with 2 images

Knowledge Booster
Similar questions
- A sample is selected from a normal population, and resulting data are as follows: 45.2, 51.5, 49.4, 48.9, 52.4, 40.0 Does this data suggest that the population mean is greater than 50? Use a = 0.05. a. State the appropriate hypotheses.. b. Calculate the value of the test statistic. c. Determine the rejection region. d. What is your conclusion? Interpret your conclusion.arrow_forwardListed below are the lead concentrations in ug/g measured in different traditional medicines. Use a 0.01 significance level to test the claim that the mean lead concentration for all such medicines is less than 18 µg/g. Assume that the sample is a simple random sample. 19 7.5 3 14 8 15 6 22.5 22.5 21.5 O Assuming all conditions for conducting a hypothesis test are met, what are the null and alternative hypotheses? Ο Α. Η0: μ= 18 μαg Ο Β. Η μ= 18 μgg H1: µ> 18 µg/g H: µ# 18 µg/g OC. Ho: H= 18 µg/g Ο D. Ho: μ> 18 μgg H,: µ< 18 µg/g H,: µ< 18 µg/g Determine the test statistic. (Round to two decimal places as needed.) Determine the P-value. (Round to three decimal places as needed.) State the final conclusion that addresses the original claim. V Ho. There is V evidence to conclude that the mean lead concentration for all such medicines is 18 μgg. Reject Fail to rejectarrow_forwardListed below are the lead concentrations in ug/g measured in different traditional medicines. Use a 0.01 significance level to test the claim that the mean lead concentration for all such medicines is less than 16 ug/g. Assume that the sample is a simple random sample. 20.5 12.5 12.5 4.5 4.5 19 18 18.5 16 Assuming all conditions for conducting a hypothesis test are met, what are the null and alternative hypotheses? O A. Ho p> 16 pg/g H p 16 ug/g %3D O C. Ho p= 16 pg/g H p#16 pg/g D. Ho =16 pg/g H1:p<16 ug/g Determine the test statistic. - 1.42 (Round to two decimal places as needed.) Determine the P-value. (Round to three decimal places as needed.)arrow_forward
- State the Result: A hypothesis test was conducted at the alpha = 0.01 level of significance. The test resulted in a p-value of 0.044.arrow_forward7) Two brands of cigarettes are selected, and their nicotine content is compared. The data are shown below.Test the claim that the population mean nicotine in the two brands are different. Use α = .01arrow_forwardTest the claim about the population mean, µ, at the given level of significance using the given sample statistics. Claim: μ = 50; x = 0.05; ♂ = 3.12. Sample statistics: x = 48.8, n = 76 Identify the null and alternative hypotheses. Choose the correct answer below. A. Ho: μ = 50 H₂: μ#50 OC. Ho: μ>50 H₂:μ=50 O E. Ho: μ = 50 H₂:μ>50 B. Ho: μ<50 H₂: H=50 Calculate the standardized test statistic. The standardized test statistic is - 3.35. (Round to two decimal places as needed.) D. H₂: μ = 50 Hg:μ < 50 OF. Ho: μ#50 H₂:μ = 50 Determine the critical value(s). Select the correct choice below and fill in the answer box to complete your choice. (Round to two decimal places as needed.) O A. The critical value is O B. The critical values are ±arrow_forward
- For your study on the food consumption of teenage males, you randomlyselected 20 males and asked each how many 12-ounce servings of soda he drinks eachday. The results are listed below. At alpha = 0.1, is there enough evidence to support theclaim that teenage males drink fewer than five 12-ounce servings of soda per day? Noneed to check the criteria –just do the hypothesis test.3.3 4.1 3.5 2.7 3.4 3.3 4.8 3.4 5.2 3.22.5 3.8 5.0 1.9 3.9 5.3 2.9 1.8 4.2 2.2arrow_forwardA radio show producer believes that a new proposed format would be preferred by only 25% of their current listeners. A survey of 100 current listeners showed that 17 favored the new format. Find the test statistic z and test the claim. H0:p= 0.25. use the significance level a=.05.arrow_forwardWhat is the answer?arrow_forward
- Consider a drug testing company that provides a test for marijuana usage. Among 294 tested subjects, results from 29 subjects were wrong (either a false positive or a false negative). Use a 0.05 significance level to test the claim that less than 10 percent of the test results are wrong. Identify the null and alternative hypotheses for this test. Choose the correct answer below. OA. Ho: p=0.1 H₁: p0.1 OD. Ho: p=0.1 H₁: p=0.1 Identify the test statistic for this hypothesis test. The test statistic for this hypothesis test is. (Round to two decimal places as needed.) Identify the P-value for this hypothesis test. The P-value for this hypothesis test is. (Round to three decimal places as needed.) Identify the conclusion for this hypothesis test.arrow_forwardTest the claim about the population mean, μ, at the given level of significance using the given sample statistics. Claim: μ≠6000; α=0.08; σ=391. Sample statistics: x=5900, n=49 Question content area bottom Part 1 Identify the null and alternative hypotheses. Choose the correct answer below. A. H0: μ≥6000 Ha: μ≠6000 B. H0: μ≠6000 Ha: μ=6000 C. H0: μ≠6000 Ha: μ≤6000 D. H0: μ=6000 Ha: μ≠6000 E. H0: μ≠6000 Ha: μ≥6000 F. H0: μ≤6000 Ha: μ≠6000arrow_forward
arrow_back_ios
arrow_forward_ios
Recommended textbooks for you
 MATLAB: An Introduction with ApplicationsStatisticsISBN:9781119256830Author:Amos GilatPublisher:John Wiley & Sons Inc
 Probability and Statistics for Engineering and th...StatisticsISBN:9781305251809Author:Jay L. DevorePublisher:Cengage Learning
 Statistics for The Behavioral Sciences (MindTap C...StatisticsISBN:9781305504912Author:Frederick J Gravetter, Larry B. WallnauPublisher:Cengage Learning
 Elementary Statistics: Picturing the World (7th E...StatisticsISBN:9780134683416Author:Ron Larson, Betsy FarberPublisher:PEARSON
 The Basic Practice of StatisticsStatisticsISBN:9781319042578Author:David S. Moore, William I. Notz, Michael A. FlignerPublisher:W. H. Freeman
 Introduction to the Practice of StatisticsStatisticsISBN:9781319013387Author:David S. Moore, George P. McCabe, Bruce A. CraigPublisher:W. H. Freeman

MATLAB: An Introduction with Applications
Statistics
ISBN:9781119256830
Author:Amos Gilat
Publisher:John Wiley & Sons Inc

Probability and Statistics for Engineering and th...
Statistics
ISBN:9781305251809
Author:Jay L. Devore
Publisher:Cengage Learning

Statistics for The Behavioral Sciences (MindTap C...
Statistics
ISBN:9781305504912
Author:Frederick J Gravetter, Larry B. Wallnau
Publisher:Cengage Learning

Elementary Statistics: Picturing the World (7th E...
Statistics
ISBN:9780134683416
Author:Ron Larson, Betsy Farber
Publisher:PEARSON

The Basic Practice of Statistics
Statistics
ISBN:9781319042578
Author:David S. Moore, William I. Notz, Michael A. Fligner
Publisher:W. H. Freeman

Introduction to the Practice of Statistics
Statistics
ISBN:9781319013387
Author:David S. Moore, George P. McCabe, Bruce A. Craig
Publisher:W. H. Freeman