MATLAB: An Introduction with Applications
6th Edition
ISBN: 9781119256830
Author: Amos Gilat
Publisher: John Wiley & Sons Inc
expand_more
expand_more
format_list_bulleted
Question

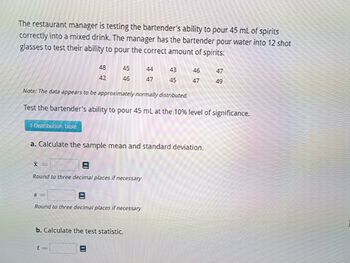
Transcribed Image Text:The restaurant manager is testing the bartender's ability to pour 45 mL of spirits
correctly into a mixed drink. The manager has the bartender pour water into 12 shot
glasses to test their ability to pour the correct amount of spirits:
1-Distribution Table
48
42
45
46
S-
x=
Round to three decimal places if necessary
Note: The data appears to be approximately normally distributed.
Test the bartender's ability to pour 45 mL at the 10% level of significance.
44
47
a. Calculate the sample mean and standard deviation.
Round to three decimal places if necessary
43
45
b. Calculate the test statistic.
46
47
47
49

Transcribed Image Text:ctions: On
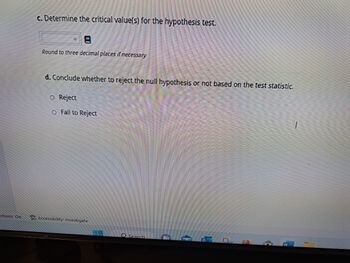
c. Determine the critical value(s) for the hypothesis test.
Round to three decimal places if necessary
d. Conclude whether to reject the null hypothesis or not based on the test statistic.
O Reject
O Fail to Reject
Accessibility: Investigate
Search
P
Expert Solution
This question has been solved!
Explore an expertly crafted, step-by-step solution for a thorough understanding of key concepts.
Step by stepSolved in 2 steps with 3 images

Knowledge Booster
Similar questions
- In the US, 43.9% of all people have type O blood, 40.6% have type A blood, 10.8% have type B blood and 4.7% have type AB blood. A researcher wants to see if the distribution of blood type is different for millionaires. The table below shows the results of a random sample of 3488 millionaires. What can be concluded at the a = 0.05 significance level? a. Complete the table by filling in the expected frequencies. Round to the nearest whole number: Frequencies of Blood Type Outcome Frequency Expected Frequency 1521 A 1427 В 376 АВ 164arrow_forwardThe accompanying data represent the miles per gallon of a random sample of cars with a three cylinder 1.0 liter enginearrow_forwardAssuming that the data are normally distributed, a. Determine the z-score such that the area to its right is 18%. z= b. Determine the z-score such that the area to its left is 91%. z=arrow_forward
- q35arrow_forwardUsing the following stem & leaf plot, find the five number summary for the data. 0 2 3 4 4 5 9 3 4 2 2 79 0 45 6 89 6 0 8 Min = Q1 Med = Q3 = %3D Max =arrow_forwardLas Vegas has seen increased competition from Singapore and Macau for customers in the casino resort industry. One measurement of success is the average length of stay by visitors. The data in this file show the number of days a random sample of visitors stayed at each location. a. Using α = 0.05 to determine if there is a difference in the average length of stay by visitors for the three locations. Follow the steps as outlined in the exercises. b. If warranted, perform a multiple comparison test to determine which pairs are different using α = 0.05. c. Verify your results using Excel.arrow_forward
- What provides a measure of the variance caused by random, unsystematic differences? a. the error term b. the F ratio c. MS d. SStotalarrow_forwardA new vaccination is being used in a laboratory experiment to investigate whether it is effective. There are 279 subjects in the study. Is there sufficient evidence to determine if vaccination and disease status are related? Vaccination Status Vaccinated Not Vaccinated Total Diseased Not Diseased Total 54 87 71 192 125 279 33 121 154 Step 4 of 8: Find the value of the test statistic. Round your answer to three decimal places. Copy Dataarrow_forwardBetty, an employee of Shining Sun Daycare Centerread an article in Healthy Child Magazine sayingthat the average 3-year-old child is 37 in. tall.Betty works with 10 3-year-olds at Shining Sun,so later that week, she measured the height ofeach child who had just turned or was about toturn 3 years old. Here are the descriptive statisticsfor the sample: M = 35, s = 3.1. State the nondirectional hypothesis.2. Determine the critical t for a = .05.3. Calculate t. Show your calculations.4. Is the height of 3-year-olds in Shining SunDaycare Center significantly different fromthe height given in the magazine?arrow_forward
- What percent of the data fall between the 1st and 2rd quartiles? 1. 0% 2. 25% 3. 50% 4. 75% 5. 100%arrow_forwardMary is running for mayor. She wants to know if she has a chance to win, so she collects a random sample of 40 citizens to see if they are going to vote for her of her opponent, Henry. Out of the 40 citizens who were asked, 24 said they were voting for Henry and the other 16 said they were voting for Mary. Using this data test H0: p=.5 vs. Ha: p>.5, where p is the true proportion of people, who will vote for Mary in the population (i.e., the entire town)? Find the p-value of this test, and what is your conclusion if the test is performed at the a=.5 level?arrow_forwardFind the test statistic for a proportion "p" given the following information. Malloree ordered 15 pair of shoes online during the stay-at-home order, and 2 pairs arrived with mismatched sizes. Looking on line, she found that the retailer claimed that this happened 4% of the time with online orders.arrow_forward
arrow_back_ios
arrow_forward_ios
Recommended textbooks for you
 MATLAB: An Introduction with ApplicationsStatisticsISBN:9781119256830Author:Amos GilatPublisher:John Wiley & Sons Inc
 Probability and Statistics for Engineering and th...StatisticsISBN:9781305251809Author:Jay L. DevorePublisher:Cengage Learning
 Statistics for The Behavioral Sciences (MindTap C...StatisticsISBN:9781305504912Author:Frederick J Gravetter, Larry B. WallnauPublisher:Cengage Learning
 Elementary Statistics: Picturing the World (7th E...StatisticsISBN:9780134683416Author:Ron Larson, Betsy FarberPublisher:PEARSON
 The Basic Practice of StatisticsStatisticsISBN:9781319042578Author:David S. Moore, William I. Notz, Michael A. FlignerPublisher:W. H. Freeman
 Introduction to the Practice of StatisticsStatisticsISBN:9781319013387Author:David S. Moore, George P. McCabe, Bruce A. CraigPublisher:W. H. Freeman

MATLAB: An Introduction with Applications
Statistics
ISBN:9781119256830
Author:Amos Gilat
Publisher:John Wiley & Sons Inc

Probability and Statistics for Engineering and th...
Statistics
ISBN:9781305251809
Author:Jay L. Devore
Publisher:Cengage Learning

Statistics for The Behavioral Sciences (MindTap C...
Statistics
ISBN:9781305504912
Author:Frederick J Gravetter, Larry B. Wallnau
Publisher:Cengage Learning

Elementary Statistics: Picturing the World (7th E...
Statistics
ISBN:9780134683416
Author:Ron Larson, Betsy Farber
Publisher:PEARSON

The Basic Practice of Statistics
Statistics
ISBN:9781319042578
Author:David S. Moore, William I. Notz, Michael A. Fligner
Publisher:W. H. Freeman

Introduction to the Practice of Statistics
Statistics
ISBN:9781319013387
Author:David S. Moore, George P. McCabe, Bruce A. Craig
Publisher:W. H. Freeman