MATLAB: An Introduction with Applications
6th Edition
ISBN: 9781119256830
Author: Amos Gilat
Publisher: John Wiley & Sons Inc
expand_more
expand_more
format_list_bulleted
Question
18. An IQ test is designed so that the

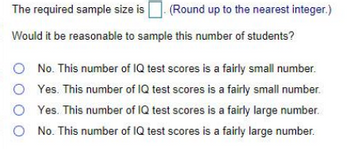
Transcribed Image Text:The required sample size is. (Round up to the nearest integer.)
Would it be reasonable to sample this number of students?
No. This number of IQ test scores is a fairly small number.
O Yes. This number of IQ test scores is a fairly small number.
Yes. This number of IQ test scores is a fairly large number.
No. This number of IQ test scores is a fairly large number.
Expert Solution
This question has been solved!
Explore an expertly crafted, step-by-step solution for a thorough understanding of key concepts.
This is a popular solution
Trending nowThis is a popular solution!
Step by stepSolved in 3 steps

Knowledge Booster
Similar questions
- In a population distribution a score of x equals 28 corresponds to z equals -1.00 and a score of x - 34 corresponds to z equals - 0.50 find the mean and standard deviation for the populationarrow_forwardUse the formula to find the standard error of the distribution of differences in sample means, x⎯⎯1−x⎯⎯2x¯1-x¯2.Samples of size 40 from Population 1 with mean 3.7 and standard deviation 1.9 and samples of size 40 from Population 2 with mean 1.9 and standard deviation 1.2Round your answer for the standard error to two decimal places.standard error = Enter your answer in accordance to the question statementarrow_forwardSuppose that we will randomly select a sample of 64 measurements from a population having a mean equal to 20 and a standard deviation equal to 4. Find the mean and the standard deviation of the sampling distribution of the sample mean . (Round your answer to 1 decimal place.)arrow_forward
- P3. Show that the mle of unknown standard deviation when the mean is known is different from the sample standard deviation when the random sample is taken from a normal population characterized by two parameters, mean and variance. Which estimator is unbiased? Justify your answer. Show that a sample mean is a minimum variance unbiased estimator of the mean of a normal population with known variance.arrow_forwardAssume that we have made 10 repeated measurements of a quantity, and as a result the error assigned to the “best estimate” of the mean is 6. If we then expand our data set to a total of 20 measurements, the error in the mean will reduce to just 3. True or Falsearrow_forwardIf we meet these conditions, the sampling distribution of the mean will have a normal shape and ... The mean of the sampling distribution will be u, (i.e., the same as the population mean) and the standard deviation of the sampling distribution will be (that's the population standard deviation divided by the square root of the sample size). In the AP Stats Guy video, he talks about the number of text messages his students send during class. Suppose the average number of text messages his students send during class is u = 30 text messages. If we take samples of say, n = 36 students at a time, we would expect the mean of the sampling distribution we create to be the same as the population mean, 30 text messages. If we can further say that standard deviation of the number of text messages is 12 text messages, by how much would we expect the sample means to vary? (hint, use the formula above) text messagesarrow_forward
arrow_back_ios
arrow_forward_ios
Recommended textbooks for you
 MATLAB: An Introduction with ApplicationsStatisticsISBN:9781119256830Author:Amos GilatPublisher:John Wiley & Sons Inc
 Probability and Statistics for Engineering and th...StatisticsISBN:9781305251809Author:Jay L. DevorePublisher:Cengage Learning
 Statistics for The Behavioral Sciences (MindTap C...StatisticsISBN:9781305504912Author:Frederick J Gravetter, Larry B. WallnauPublisher:Cengage Learning
 Elementary Statistics: Picturing the World (7th E...StatisticsISBN:9780134683416Author:Ron Larson, Betsy FarberPublisher:PEARSON
 The Basic Practice of StatisticsStatisticsISBN:9781319042578Author:David S. Moore, William I. Notz, Michael A. FlignerPublisher:W. H. Freeman
 Introduction to the Practice of StatisticsStatisticsISBN:9781319013387Author:David S. Moore, George P. McCabe, Bruce A. CraigPublisher:W. H. Freeman

MATLAB: An Introduction with Applications
Statistics
ISBN:9781119256830
Author:Amos Gilat
Publisher:John Wiley & Sons Inc

Probability and Statistics for Engineering and th...
Statistics
ISBN:9781305251809
Author:Jay L. Devore
Publisher:Cengage Learning

Statistics for The Behavioral Sciences (MindTap C...
Statistics
ISBN:9781305504912
Author:Frederick J Gravetter, Larry B. Wallnau
Publisher:Cengage Learning

Elementary Statistics: Picturing the World (7th E...
Statistics
ISBN:9780134683416
Author:Ron Larson, Betsy Farber
Publisher:PEARSON

The Basic Practice of Statistics
Statistics
ISBN:9781319042578
Author:David S. Moore, William I. Notz, Michael A. Fligner
Publisher:W. H. Freeman

Introduction to the Practice of Statistics
Statistics
ISBN:9781319013387
Author:David S. Moore, George P. McCabe, Bruce A. Craig
Publisher:W. H. Freeman