MATLAB: An Introduction with Applications
6th Edition
ISBN: 9781119256830
Author: Amos Gilat
Publisher: John Wiley & Sons Inc
expand_more
expand_more
format_list_bulleted
Question

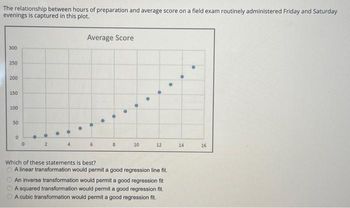
Transcribed Image Text:The relationship between hours of preparation and average score on a field exam routinely administered Friday and Saturday
evenings is captured in this plot.
300
250
200
150
100
50
0
0
2
4
Average Score
6
8
10
12
Which of these statements is best?
A linear transformation would permit a good regression line fit.
An inverse transformation would permit a good regression fit
A squared transformation would permit a good regression fit.
A cubic transformation would permit a good regression fit.
14
16
Expert Solution
This question has been solved!
Explore an expertly crafted, step-by-step solution for a thorough understanding of key concepts.
This is a popular solution
Trending nowThis is a popular solution!
Step by stepSolved in 4 steps

Knowledge Booster
Similar questions
- Q1arrow_forwardplease show workarrow_forwardWould you please assist in answering this question with working out?Thank you. Q. Using a sample of recent university graduates, you estimate a simple linear regression using initial annual salary as the dependent variable and the graduate's weighted average mark (WAM) as the explanatory variable. If the regression model has an estimated intercept of 2200 and an estimated slope coefficient of 550, what is the predicted starting salary of a student with a WAM of 82?arrow_forward
- help please answer in text form with proper workings and explanation for each and every part and steps with concept and introduction no AI no copy paste remember answer must be in proper format with all workingarrow_forwardEQuestion Help Find the equation of the regression line for the given data. Then construct a scatter plot of the data and draw the regression line. (The pair of variables have a significant correlation) Then use the regression equation to predict the value of y for each of the given x-values, if meaningful. The number of hours 6 students spent for a test and their scores on that test are shown below. Hours spent studying, x IA Test score,y 3 (a) x=2 hours (c) x= 12 hours (b) x = 25 hours (d) x= 4.5 hours 38 44 50 47 61 68 Find the regression equation. y = 6.269 x+ (32.48) (Round the slope to three decimal places as needed. Round the y-intercept to two decimal places as needed.) Choose the correct graph below. OD. OB. OC. O A. 80- 80- 80 80-4 0-+ Hours studying Hours studying Hours studying Hours studying 10 18 PM (E) More 10/3/2020 Click to select your answer(s)arrow_forwardIn R there is a dataset called diamonds that contains measurements of about 500 diamonds sold in the US. There are three variables present: price (price in US dollar), carat (weight of the diamond), and table (width of top of diamond relative to the widest point). The attached image is a screenshot of the R dataset with the regression table and all that. ANSWER THIS QUESTION IN WORDS: Discuss the regression between the variables table and price. You should address the explanatory variable, response variable, correlation, and sign. You should interpret the slope, the t and p-value, and how much is explained by the response.arrow_forward
- Answer questions A_C show workarrow_forwardTwo variables are defined, a regression equation is given, and one data point is given. Study = number of hours spent studying for an exam Grade = grade on the exam GRADE= 41.0 + 3.7 (STUDY) THE DATA POINT IS A STUDENT WHO STUDIED 10 HOURS AND RECIEVED AN 81 ON THE EXAM…arrow_forwardPlease do not give solution in image format thankuarrow_forward
arrow_back_ios
arrow_forward_ios
Recommended textbooks for you
 MATLAB: An Introduction with ApplicationsStatisticsISBN:9781119256830Author:Amos GilatPublisher:John Wiley & Sons Inc
 Probability and Statistics for Engineering and th...StatisticsISBN:9781305251809Author:Jay L. DevorePublisher:Cengage Learning
 Statistics for The Behavioral Sciences (MindTap C...StatisticsISBN:9781305504912Author:Frederick J Gravetter, Larry B. WallnauPublisher:Cengage Learning
 Elementary Statistics: Picturing the World (7th E...StatisticsISBN:9780134683416Author:Ron Larson, Betsy FarberPublisher:PEARSON
 The Basic Practice of StatisticsStatisticsISBN:9781319042578Author:David S. Moore, William I. Notz, Michael A. FlignerPublisher:W. H. Freeman
 Introduction to the Practice of StatisticsStatisticsISBN:9781319013387Author:David S. Moore, George P. McCabe, Bruce A. CraigPublisher:W. H. Freeman

MATLAB: An Introduction with Applications
Statistics
ISBN:9781119256830
Author:Amos Gilat
Publisher:John Wiley & Sons Inc

Probability and Statistics for Engineering and th...
Statistics
ISBN:9781305251809
Author:Jay L. Devore
Publisher:Cengage Learning

Statistics for The Behavioral Sciences (MindTap C...
Statistics
ISBN:9781305504912
Author:Frederick J Gravetter, Larry B. Wallnau
Publisher:Cengage Learning

Elementary Statistics: Picturing the World (7th E...
Statistics
ISBN:9780134683416
Author:Ron Larson, Betsy Farber
Publisher:PEARSON

The Basic Practice of Statistics
Statistics
ISBN:9781319042578
Author:David S. Moore, William I. Notz, Michael A. Fligner
Publisher:W. H. Freeman

Introduction to the Practice of Statistics
Statistics
ISBN:9781319013387
Author:David S. Moore, George P. McCabe, Bruce A. Craig
Publisher:W. H. Freeman