MATLAB: An Introduction with Applications
6th Edition
ISBN: 9781119256830
Author: Amos Gilat
Publisher: John Wiley & Sons Inc
expand_more
expand_more
format_list_bulleted
Concept explainers
Topic Video
Question

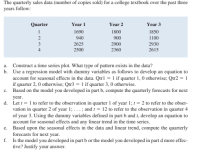
Transcribed Image Text:The quarterly sales data (number of copies sold) for a college textbook over the past three
years follow:
Quarter
Year 1
Year 2
Year 3
1690
1800
1850
940
900
1100
2625
2900
2930
4
2500
2360
2615
Expert Solution
This question has been solved!
Explore an expertly crafted, step-by-step solution for a thorough understanding of key concepts.
This is a popular solution
Trending nowThis is a popular solution!
Step by stepSolved in 2 steps with 5 images

Knowledge Booster
Learn more about
Need a deep-dive on the concept behind this application? Look no further. Learn more about this topic, statistics and related others by exploring similar questions and additional content below.Similar questions
- Please answer questions 8 and 9 fully, data included: Size($) Rent(sq.feet) 850 1950 1450 2600 1085 2200 1232 2500 718 1950 1485 2700 1136 2650 726 1935 700 1875 956 2150 1100 2400 1285 2650 1985 3300 1369 2800 1175 2400 1225 2450 1245 2100 1259 2700 1150 2200 896 2150 1361 2600 1040 2650 755 2200 1000 1800 1200 2750 A real estate agent wishes to examine the relationship between the selling price of a home (measured in thousands of dollars) and its size (measured in square feet). In particular she wants to assess if the size of the home can accurately predict the house’s selling price.arrow_forwardDescribe and explain the changes shown by the table between the two years for the following age groups: 1-5 years, 11-20 years, 21-50 years, and 61-90 years Answer: 2019 Female 2019 Male 2021 Female 2021 Male 1 to 5 years old 4.1% 4.5% 4.0% 4.4% 11 to 20 years old 8.7% 9.8% 8.6% 9.5% 21 to 50 years old 21.5% 23.6% 21.7% 23.8% 61 to 90 years old 4.9% 4.8% 5.2% 5%arrow_forwardPlease answer question 9 fully, data included: Size($) Rent(sq.feet) 850 1950 1450 2600 1085 2200 1232 2500 718 1950 1485 2700 1136 2650 726 1935 700 1875 956 2150 1100 2400 1285 2650 1985 3300 1369 2800 1175 2400 1225 2450 1245 2100 1259 2700 1150 2200 896 2150 1361 2600 1040 2650 755 2200 1000 1800 1200 2750 A real estate agent wishes to examine the relationship between the selling price of a home (measured in thousands of dollars) and its size (measured in square feet). In particular she wants to assess if the size of the home can accurately predict the house’s selling price.arrow_forward
- Is this right?arrow_forwardplease assist with this NON GRADED problem. data file information is below Price Mileage Age 16998 35000 3 17599 16000 3 15998 42000 3 15998 61000 4 11599 102000 7 13998 109000 4 14998 60000 5 11599 88000 9 12599 58000 8 14998 27000 6 15998 32000 4 11599 95000 8 10499 123000 8 14599 54000 5 10599 68000 11 16998 40000 4 20998 7000 1 11599 81000 9 12599 70000 6 13599 86000 5 11599 92000 7 9599 120000 10 18998 20000 2 12599 63000 7 12599 70000 6 10998 88000 10 11998 86000 6 12998 60000 6 17599 45000 2 9998 96000 11 9998 60000 11 16998 36000 2 17599 45000 2arrow_forwardYear Population 1790 3,929,214 1800 5,308,483 1810 7,239,881 1820 9,638,453 1830 12,866,020 1840 17,069,453 1850 23,191,876 1860 31,443,321 1870 39,818,449 1880 50,155,783 1890 62,947,714 1900 75,994,575 1910 91,972,266 1920 105,710,620 1930 122,775,046 1940 131,669,275 1950 150,697,361 1960 179,323,175 1970 203,302,031 1980 226,545,805 1990 248,709,873 2000 281,421,906 2010 308,745,538 Use excel to calculate the Least Squares Regression Line for the census data? (need to include correct values for a and b) Using the line, you calculated in number 5, what would you predict the population to have been in 1985? EXPLAIN. Should you use the previously calculated Regression Line to predict population in the year 2200? EXPLAIN.arrow_forward
arrow_back_ios
arrow_forward_ios
Recommended textbooks for you
 MATLAB: An Introduction with ApplicationsStatisticsISBN:9781119256830Author:Amos GilatPublisher:John Wiley & Sons Inc
 Probability and Statistics for Engineering and th...StatisticsISBN:9781305251809Author:Jay L. DevorePublisher:Cengage Learning
 Statistics for The Behavioral Sciences (MindTap C...StatisticsISBN:9781305504912Author:Frederick J Gravetter, Larry B. WallnauPublisher:Cengage Learning
 Elementary Statistics: Picturing the World (7th E...StatisticsISBN:9780134683416Author:Ron Larson, Betsy FarberPublisher:PEARSON
 The Basic Practice of StatisticsStatisticsISBN:9781319042578Author:David S. Moore, William I. Notz, Michael A. FlignerPublisher:W. H. Freeman
 Introduction to the Practice of StatisticsStatisticsISBN:9781319013387Author:David S. Moore, George P. McCabe, Bruce A. CraigPublisher:W. H. Freeman

MATLAB: An Introduction with Applications
Statistics
ISBN:9781119256830
Author:Amos Gilat
Publisher:John Wiley & Sons Inc

Probability and Statistics for Engineering and th...
Statistics
ISBN:9781305251809
Author:Jay L. Devore
Publisher:Cengage Learning

Statistics for The Behavioral Sciences (MindTap C...
Statistics
ISBN:9781305504912
Author:Frederick J Gravetter, Larry B. Wallnau
Publisher:Cengage Learning

Elementary Statistics: Picturing the World (7th E...
Statistics
ISBN:9780134683416
Author:Ron Larson, Betsy Farber
Publisher:PEARSON

The Basic Practice of Statistics
Statistics
ISBN:9781319042578
Author:David S. Moore, William I. Notz, Michael A. Fligner
Publisher:W. H. Freeman

Introduction to the Practice of Statistics
Statistics
ISBN:9781319013387
Author:David S. Moore, George P. McCabe, Bruce A. Craig
Publisher:W. H. Freeman