
MATLAB: An Introduction with Applications
6th Edition
ISBN: 9781119256830
Author: Amos Gilat
Publisher: John Wiley & Sons Inc
expand_more
expand_more
format_list_bulleted
Related questions
Question
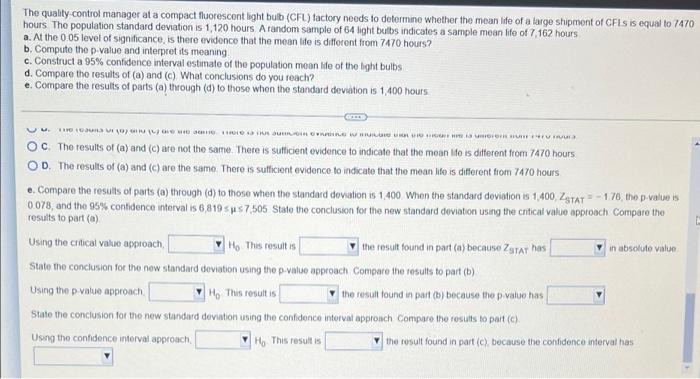

Transcribed Image Text:The quality-control manager at a compact fluorescont light bulb (CFL) factory needs to determine whether the mean life of a large shipment of CFLS is equal to 7470
hours The population standard deviation is 1,120 hours A random sample of 64 light bulbs indicates a sample mean life of 7,162 hours
a. At the 0.05 level of significance, is there evidence that the mean life is different from 7470 hours?
b. Compute the p-value and interpret its meaning.
c. Construct a 95% confidence interval estimate of the population mean lide of the bight bulbs
d. Compare the results of (a) and (c) What conclusions do you reach?
e. Compare the results of parts (a) through (d) to those when the standard deviation is 1,400 hours
CU aua aj u e e ae e a aunn nn wRune e H a uore U Uura
OC. The results of (a) and (c) are not the same. There is sufficient evidence to indicate that the mean ife is different from 7470 hours
OD. The results of (a) and (c) are the same There is sufficient evidence to indicate that the mean life is different from 7470 hours
e. Compare the results of parts (a) through (d) to those when the standard deviation is 1,400 When the standard deviation is 1,400, ZeTAT-176, the p-value is
0 078, and the 95% confidence interval is 6,819 sus7,505 State the conclusion for the new standard deviation using the cntical value approach Compare the
results to part (a)
Using the critical value approach,
Ho This result is
V the result found in part (a) because Z9TAT has
in absolute value
State the conclusion for the new standard deviation using the p-value approach Compare the results to part (b)
Using the p value approach,
V Họ This result is
the result found in part (b) because the p value has
State the conclusion for the new standard deviation using the confidence interval approach Compare the results to part (c)
Using the confidence interval approach,
V Ho This result is
V the result found in part (c), because the confidence interval has

Transcribed Image Text:The quality-control manager at a compact fluorescent light bulb (CFL) factory neods to determine whether the mean life of a large shipment of CFLS is equal to 7470
hours. The population standard deviation is 1,120 hours A random sample of 64 light bulbs indicates a sample mean Me of 7,162 hours
a. At the 0 05 level of significance, is there evidence that the mean ife is different from 7470 hours?
b. Compute the p-value and interpret its meaning
c. Construct a 95% confidence interval estiımate of the population mean life of the light buibs
d. Compare the results of (a) and (c) What conclusions do you reach?
e. Compare the results of parts (a) through (d) to those when the standard deviation is 1,400 hours
What is/are the critical value(s)?
(Round to two decimal places as needed Use a comma to separate answers as needed )
What is the final conclusion?
OA Reject H, There is suficient evidence to ndicate that the mean ife is difforent from 7470 hours
OB. Fail to reject H, There is not sufticient evidence to indicate that the mean ife is different trom 7470 hours
OC. Fail to rejoct H There is sufficient evidence to indicate that the mean ife is diferent from 7470 hours
OD. Reject H, There is not suffcient evidence to indicate that the mean ide is diferent from 7470 hours
b. What is the p-value?
O(Round to three decimal places as needed )
Interpret the meaning of the p-value
The quality-control manager at a compact fluorescent light bulb (CFL) factory needs to determine whether the mean ife of a large shipment of CFLS is equal to 7470
hours. The population standard deviation is 1,120 hours Arandom sample of 64 light bulbs indicates a sample mean ife of 7,162 hours
a. Al the 0 05 level of significance, is there evidence that the mean life is different from 7470 hours?
b. Compute the p -value and interpret its meaning
c. Construct a 95% confidence interval estimate of the population mean life of the ight bulbs
d. Compare the results of (a) and (c) What conclusions do you reach?
e. Compare the results of parts (a) through (d) to those when the standard deviation is 1,400 hours
I5
Interpret the meaning of the p value.
The p-value is the probability of obtaining
with a mean
hours, given that the
hypothesis is true
e. Construct a 05% confidence interval estimate of the population mean Iife of the light bulbs
Osus (Round to the noarest whole number as needed)
d. Compare the results of (a) and (c) What conclusions do you reach?
OA The results of (0) and (c) are not the same. There is not sufficient evidence to indicate that the mean ife is different from 7470 hours
OB. The results of (a) and (c) are the same There is not sufficient evidence to indicate that the mean ife is different from 7470 hours
OC. The results of (a) and (c) are not the same There is sufficent evidence to indicate that the mean ife is diferent from 7470 hours
OD. The results of (0) and (c) are the same There is suficient evidence to indicate that the mean fe is diferent hom 7470 hours
. Compare the results of parts (a) through (d) to those when the standard deviation is 1.400 When the standard deviation is 1,400, ZgTAT-176, the p value is
0 078, and the 95% confidence interval is 6.819sus7.505 State the conclusion for the new standard deviation using the crtical value approach Compare the
results to part (a)
Expert Solution
This question has been solved!
Explore an expertly crafted, step-by-step solution for a thorough understanding of key concepts.

Step by stepSolved in 4 steps

Knowledge Booster

Similar questions
- On a standardized exam, the scores are normally distributed with a mean of 350 and a standard deviation of 20. Find the z-score of a person who scored 400 on the exam.arrow_forwardAssume the average amount of caffeine consumed daily by adults is normally distributed with a mean of 260 mg and a standard deviation of 48 mg. In a random sample of 600 adults, how many consume at least 320 mg of caffeine daily?arrow_forwardThe shelf life of a battery produced by one major company is known to be Normally distributed, with a mean life of 3.5 years and a standard deviation of 0.75 years. What is the upper quartile of battery shelf life? Use the fact that the middle 50% of the data falls within 0.67 standard deviations from the mean.arrow_forward
- The mean systolic blood pressure for white males aged 35-44 in Canada is U. A report said that the mean blood pressure and standard deviation of a sample of 13 diabetic males aged 35-44 are 128.53 and 7.59, respectively. Let μ denote the true mean systolic blood pressure for diabetic males aged 35-44. H0: μ = 126.38 versus Ha: μ > 126.38 What is the p-value? A.) 0.836 B.) 0.327 C.) 0.418 D.) 0.164arrow_forwardCurrently patrons at the library speak at an average of 60 decibels. Will this average decline after the installation of a new computer plug in station? After the plug in station was built, the librarian randomly recorded 61 people speaking at the library. Their average decibel level was 57.2 and their standard deviation was 7. What can be concluded at the the a = 0.10 level of significance?arrow_forwardA tire manufacturer claims that the mean life of its tire is 75,000 miles. The mean of a sample of 50 tires is 74,200 miles with a standard deviation of 2300 miles. Using an alpha of 5%, does the manufacturer’s claim appear to hold ture? Explain.arrow_forward
- Records indicate that the mean weight of mature rainbow trout in Eagle Creek is 1.75 kg with a standard deviation of 0.33 kg. After years of marked oxygen depletion from pollutants in the creek, a biologist wants to see if the standard deviation, o, of weights has changed. The biologist measures the weights of 20 randomly chosen mature rainbow trout from the creek and finds that the sample standard deviation is 0.38 kg. Assume the current weights of mature rainbow trout in the creek follow a normal distribution. Does the biologist have sufficient evidence to conclude that the population standard deviation, o, differs from 0.33 kg? To answer, complete the parts below to perform a hypothesis test. Use the 0.10 level of significance.arrow_forwardA newspaper article noted that the mean life span for 35 male symphony conductors was 73.2 years with a standard deviation of 8.7 . Males in the general population have a mean life span of 69.5 years. Use a 0.05 significance level to test the claim that male symphony conductors have a mean life span that is greater than 69.5 years. a. Define the parameter A. mu = The mean life span of the 35 male symphony conductors in the sample B. p = The proportion of all male symphony conductors who life more than 69.5 years C. mu = The mean life span of all male symphony conductors D. mu = The mean life span of all males b. State the null and alternative hypotheses A. Upper H 0 : mu equals 73.2 Upper H 1 : mu greater than 73.2 B. Upper H 0 : mu equals 69.5 Upper H 1 : mu greater than 69.5 C. Upper H 0 : mu greater than 69.5 Upper H 1 : mu equals 69.5 D. Upper H 0…arrow_forwardDuring the busy season, it is important for the shipping manager at ShipMundo to be able to estimate the time it takes the loading crew to load a truck. The shipping manager has found that she can model the load times using a normal distribution with a mean of 152 minutes and a standard deviation of 15 minutes. Use this table or the ALEKS calculator to find the percentage of load times between 116 minutes and 149 minutes according to the model. For your intermediate computations, use four or more decimal places. Give your final answer to two decimal places (for example 98.23%).arrow_forward
arrow_back_ios
arrow_forward_ios
Recommended textbooks for you
- MATLAB: An Introduction with ApplicationsStatisticsISBN:9781119256830Author:Amos GilatPublisher:John Wiley & Sons Inc
 Probability and Statistics for Engineering and th...StatisticsISBN:9781305251809Author:Jay L. DevorePublisher:Cengage Learning
 Statistics for The Behavioral Sciences (MindTap C...StatisticsISBN:9781305504912Author:Frederick J Gravetter, Larry B. WallnauPublisher:Cengage Learning
  Elementary Statistics: Picturing the World (7th E...StatisticsISBN:9780134683416Author:Ron Larson, Betsy FarberPublisher:PEARSON
 The Basic Practice of StatisticsStatisticsISBN:9781319042578Author:David S. Moore, William I. Notz, Michael A. FlignerPublisher:W. H. Freeman
 Introduction to the Practice of StatisticsStatisticsISBN:9781319013387Author:David S. Moore, George P. McCabe, Bruce A. CraigPublisher:W. H. Freeman
MATLAB: An Introduction with Applications
Statistics
ISBN:9781119256830
Author:Amos Gilat
Publisher:John Wiley & Sons Inc
Probability and Statistics for Engineering and th...
Statistics
ISBN:9781305251809
Author:Jay L. Devore
Publisher:Cengage Learning
Statistics for The Behavioral Sciences (MindTap C...
Statistics
ISBN:9781305504912
Author:Frederick J Gravetter, Larry B. Wallnau
Publisher:Cengage Learning
Elementary Statistics: Picturing the World (7th E...
Statistics
ISBN:9780134683416
Author:Ron Larson, Betsy Farber
Publisher:PEARSON
The Basic Practice of Statistics
Statistics
ISBN:9781319042578
Author:David S. Moore, William I. Notz, Michael A. Fligner
Publisher:W. H. Freeman
Introduction to the Practice of Statistics
Statistics
ISBN:9781319013387
Author:David S. Moore, George P. McCabe, Bruce A. Craig
Publisher:W. H. Freeman