MATLAB: An Introduction with Applications
6th Edition
ISBN: 9781119256830
Author: Amos Gilat
Publisher: John Wiley & Sons Inc
expand_more
expand_more
format_list_bulleted
Question

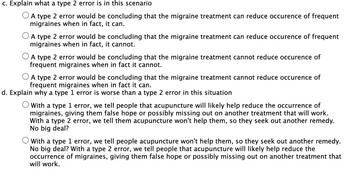
Transcribed Image Text:c. Explain what a type 2 error is in this scenario
O A type 2 error would be concluding that the migraine treatment can reduce occurence of frequent
migraines when in fact, it can.
O A type 2 error would be concluding that the migraine treatment can reduce occurence of frequent
migraines when in fact, it cannot.
O A type 2 error would be concluding that the migraine treatment cannot reduce occurence of
frequent migraines when in fact it cannot.
O A type 2 error would be concluding that the migraine treatment cannot reduce occurence of
frequent migraines when in fact it can.
d. Explain why a type 1 error is worse than a type 2 error in this situation
O With a type 1 error, we tell people that acupuncture will likely help reduce the occurrence of
migraines, giving them false hope or possibly missing out on another treatment that will work.
With a type 2 error, we tell them acupuncture won't help them, so they seek out another remedy.
No big deal?
O with a type 1 error, we tell people acupuncture won't help them, so they seek out another remedy.
No big deal? With a type 2 error, we tell people that acupuncture will likely help reduce the
occurrence of migraines, giving them false hope or possibly missing out on another treatment that
will work.

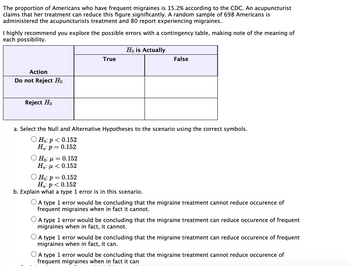
Transcribed Image Text:The proportion of Americans who have frequent migraines is 15.2% according to the CDC. An acupuncturist
claims that her treatment can reduce this figure significantly. A random sample of 698 Americans is
administered the acupuncturists treatment and 80 report experiencing migraines.
I highly recommend you explore the possible errors with a contingency table, making note of the meaning of
each possibility.
Action
Do not Reject Ho
Reject Ho
=
True
Ho: μ = 0.152
Ha: μ < 0.152
Ho is Actually
a. Select the Null and Alternative Hypotheses to the scenario using the correct symbols.
O Ho: p < 0.152
Ha: P
0.152
False
Ho: p = 0.152
Ha: p < 0.152
b. Explain what a type 1 error is in this scenario.
A type 1 error would be concluding that the migraine treatment cannot reduce occurence of
frequent migraines when in fact it cannot.
O A type 1 error would be concluding that the migraine treatment can reduce occurence of frequent
migraines when in fact, it cannot.
O A type 1 error would be concluding that the migraine treatment can reduce occurence of frequent
migraines when in fact, it can.
A type 1 error would be concluding that the migraine treatment cannot reduce occurence of
frequent migraines when in fact it can
Expert Solution
This question has been solved!
Explore an expertly crafted, step-by-step solution for a thorough understanding of key concepts.
This is a popular solution
Trending nowThis is a popular solution!
Step by stepSolved in 2 steps

Knowledge Booster
Similar questions
- Please see picture and answer questions A and B (a)Which city had the highest noon temperature? Choose one (City A/ City b/ Both had the highest) (b)Which city had noon temperatures with a larger interquartile range (IQR)? Choose one (City A/ City B/ Both had the same IQR)arrow_forwardplease use calculator method and include p valuesarrow_forwarda and b please thank youarrow_forward
- There are 9 million enrollees in the Department of Veterans Affairs health care system. It wants doctors and nurses to treat pain as a “fifth vital sign” to be recorded along with blood pressure, pulse, temperature, and breathing rate. If you were to aid the VA in this situation, how would you measure a patient’s pain? How could this “fifth vital sign” be a potentially invalid measure? Answer each question with at least one paragraph of three complete sentences.arrow_forwardA researcher designs an intervention to combat anti-Arab oppression. She also designs a questionnaire to measure anti-Arab oppression so she can test the participants' level of anti-Arab oppression before and after the intervention. She tests one version of her questionnaire with 45 statements and a shorter version with 12 statements. In both questionnaires, the participants respond to each statement with a rating on a 5-point Likert scale with 0 equaling "strongly disagree" and 4 equaling "strongly agree." The overall score for each participant is the mean of his or her ratings for the different statements on the questionnaire. Look at the following graphs. Graph I graphs the results from the long version, and Graph II graphs the results from the short version. Graph I Graph II PARTICIPANTS PARTICIPANTS 8 8 7 7 6 6 4 4 3 3 2 1 1 1 2 3 4 2 4 LONG QUESTIONNAIRE SCORE SHORT QUESTIONNAIRE SCORE Complete the following sentences by trusting your eyes to see meaningful differences in the two…arrow_forwardWhich of the following conclusion would represent a Type II error? Concluding that the average voter turnout at presidential election will change when in fact turnout will not /did not change. Concluding that the average voter turnout at presidential election will not change when in fact turnout will / did change.arrow_forward
- Base on the same given data uploaded in module 4, will you conclude that the number of bathroom of houses is a significant factor for house price? I your answer is affirmative, you need to explain how the number of bathroom influences the house price, using a post hoc procedure. (Please treat number of bathrooms as a categorical variable in this analysis) Base on the same given data, conduct an analysis for the variable sale price to see if sale price is influenced by living area. Summarize your finding including all regular steps for your method. Also, will you conclude that larger house corresponding to higher price (justify)?arrow_forwardA researcher is testing if listening to 2 Chainz helps with studying. He finds that it does not. However, after more research is conducted, it is found that listening to 2 Chainz does indeed aid in studying. Is this Type I or Type II error?arrow_forwardA professor claims that the average grade of students in her courses is 80%. Identify Type II error for this claim. O Fail to reject the claim that average grade is 80% when it is actually 80%. O Fail to reject the claim that average grade is 80% when it is actually different from 80%. O Reject the claim that average grade is 80% when it is actually 80%. O Reject the claim that average grade is 80% when it is actually different from 80%.arrow_forward
arrow_back_ios
arrow_forward_ios
Recommended textbooks for you
 MATLAB: An Introduction with ApplicationsStatisticsISBN:9781119256830Author:Amos GilatPublisher:John Wiley & Sons Inc
 Probability and Statistics for Engineering and th...StatisticsISBN:9781305251809Author:Jay L. DevorePublisher:Cengage Learning
 Statistics for The Behavioral Sciences (MindTap C...StatisticsISBN:9781305504912Author:Frederick J Gravetter, Larry B. WallnauPublisher:Cengage Learning
 Elementary Statistics: Picturing the World (7th E...StatisticsISBN:9780134683416Author:Ron Larson, Betsy FarberPublisher:PEARSON
 The Basic Practice of StatisticsStatisticsISBN:9781319042578Author:David S. Moore, William I. Notz, Michael A. FlignerPublisher:W. H. Freeman
 Introduction to the Practice of StatisticsStatisticsISBN:9781319013387Author:David S. Moore, George P. McCabe, Bruce A. CraigPublisher:W. H. Freeman

MATLAB: An Introduction with Applications
Statistics
ISBN:9781119256830
Author:Amos Gilat
Publisher:John Wiley & Sons Inc

Probability and Statistics for Engineering and th...
Statistics
ISBN:9781305251809
Author:Jay L. Devore
Publisher:Cengage Learning

Statistics for The Behavioral Sciences (MindTap C...
Statistics
ISBN:9781305504912
Author:Frederick J Gravetter, Larry B. Wallnau
Publisher:Cengage Learning

Elementary Statistics: Picturing the World (7th E...
Statistics
ISBN:9780134683416
Author:Ron Larson, Betsy Farber
Publisher:PEARSON

The Basic Practice of Statistics
Statistics
ISBN:9781319042578
Author:David S. Moore, William I. Notz, Michael A. Fligner
Publisher:W. H. Freeman

Introduction to the Practice of Statistics
Statistics
ISBN:9781319013387
Author:David S. Moore, George P. McCabe, Bruce A. Craig
Publisher:W. H. Freeman