
ENGR.ECONOMIC ANALYSIS
14th Edition
ISBN: 9780190931919
Author: NEWNAN
Publisher: Oxford University Press
expand_more
expand_more
format_list_bulleted
Related questions
Question
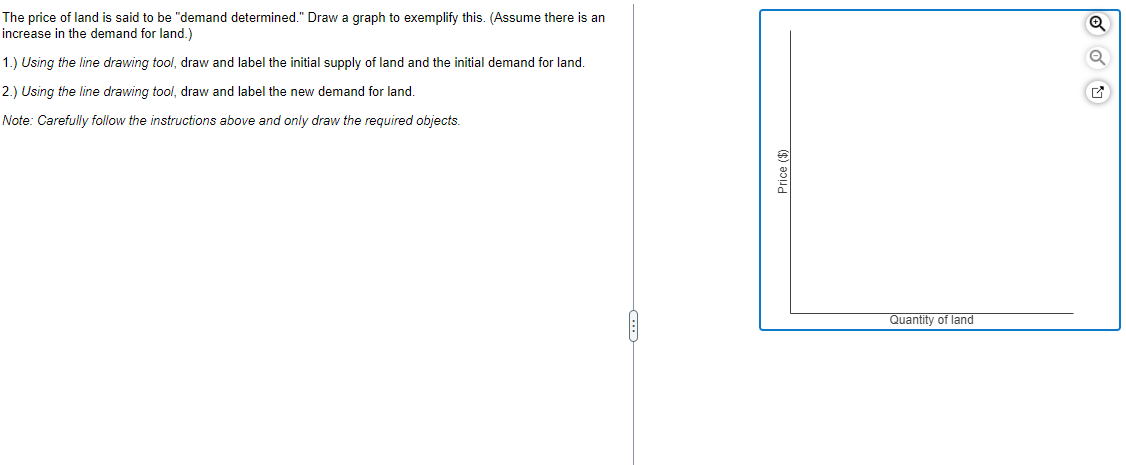

Transcribed Image Text:The price of land is said to be "demand determined." Draw a graph to exemplify this. (Assume there is an
increase in the demand for land.)
1.) Using the line drawing tool, draw and label the initial supply of land and the initial demand for land.
2.) Using the line drawing tool, draw and label the new demand for land.
Note: Carefully follow the instructions above and only draw the required objects.
Price ($)
Quantity of land
G
Expert Solution
This question has been solved!
Explore an expertly crafted, step-by-step solution for a thorough understanding of key concepts.

This is a popular solution

Trending nowThis is a popular solution!

Step by stepSolved in 3 steps with 4 images

Knowledge Booster


Learn more about
Need a deep-dive on the concept behind this application? Look no further. Learn more about this topic, economics and related others by exploring similar questions and additional content below.Similar questions
- What effect over the last decade, has the increasingly efficient and inexpensive technology of online college courses had on the college textbook market? Question 48 options: a) The demand for physical textbooks have steadily decreased, and as a result more publishing companies are having less demand for high skilled textbook editor jobs. b) The demand for textbooks has declined resulting in publishing companies increasing their demand of textbook editor jobs. c) The demand for textbook has increased as well as the supply. d) The supply for college textbooks has increased as a result there are fewer textbook publishing companies.arrow_forwardThe following graph shows the annual market for Florida oranges, which are sold in units of 90-pound boxes. Use the graph input tool to help you answer the following questions. You will not be graded on any changes you make to this graph. Note: Once you enter a value in a white field, the graph and any corresponding amounts in each grey field will change accordingly. Graph Input Tool Market for Florida Oranges 50 I Price (Dollars per box) 45 15 Supply 40 Quantity Demanded Quantity Supplied (Millions of boxes) 500 210 35 (Millions of boxes) 30 25 20 Demand 15 10 50 100 150 200 250 300 350 400 450 500 QUANTITY (Millions of boxes) In this market, the equilibrium price is S per box, and the equilibrium quantity of oranges is million boxes. PRICE (Dollars per box)arrow_forwardRefer to Table 2-3 What is the new equilibrium price for COC t-shirts (as a result of the decrease in the price of cotton)? (write just the number, not the $)arrow_forward
- Consider the following graph of a supply curve: Price P=Y Axis Quantity Q= X Axis Units of Y 2 C. D 3 6 B 9 Units of X 12 Write the linear equation and compute the slope and the intercept b. Write the equation for the 45 degree line starting at zero. Is this line above or below the supply curve? What would be the price for a supplied amount of 14?arrow_forwardCan you answer A, b, c, darrow_forward1) The cost of satellite internet drops. How will this impact the supply and demand for cable internet? Explain. 2) Consider Question 1. Graph any changes you describe. Be sure to include the change in equilibrium.arrow_forward
- Quantity per unit of time C Quantity per unit of time Refer to the graph above. Assume the graph reflects demand in the automobile market. Which arrow best captures the impact of increased prices of automobiles on the automobile market? OA. A OB, B C.C D. Darrow_forwardThe following graph shows the market for orange juice. Use the graph input tool to help you answer the following questions. You will not be graded on any changes you make to this graph. Note: Once you enter a value in a white field, the graph and any corresponding amounts in the grey field will change accordingly. PRICE (Dollars per gallon) 12 Graph Input Tool ? Price 2 (Dollars per gallon) Supply 10 Quantity 112 Quantity supplied demanded (Millions of gallons) 22 22 (Millions of gallons) 00 Surplus 0 (Millions of gallons) Shortage (Millions of gallons) 00 90 + Demand 0 0 15 30 45 60 75 90 105 QUANTITY (Millions of gallons) 120 135 The market price of orange juice without government intervention is $ per gallon. Consider legislation that doesn't allow the price of orange juice to be below $9 per gallon and stipulates that the government buy any surplus orange juice produced at that price. In order to raise the price to $9 per gallon, the government would need to buy million gallons of…arrow_forwardplease do it quick i need it as soon as possible.(3) Sketch a supply and demand model of the housing (home ownership) market. Label the equilibrium price and equilibrium quantity. Now sketch in TWO changes on the same graph: an increase in demand; a reduction in supply.arrow_forward
- This problem involves solving demand and supply equations together to determine price and quantity. a. Consider a demand curve of the form QD=-2P+20, where QD is the quantity demanded of a good and P is the price of the good. Graph this demand curve. Also draw a graph of the supply curve Qs =2P-4, where Qs is the quantity supplied. Be sure to put P on the vertical axis and Q on the horizontal axis. Assume that all the Qs and Ps are nonnegative for parts a, b, and c. At what values of P and Q do these curves intersect-that is, where does QD = Qs ? b. Now, suppose at each price that individuals demand four more units of output-that the demand curve shifts to QD - 2P+24. Graph this new demand curve. At what values of P and Q does the new demand curve intersect the old supply curve-that is, where does QD = Qs ? c. Now finally, suppose the supply curve shifts to Q's=2P-8. Graph this new supply curve. At what values of P and Q does QD=Q's? Show all working calculations and label garph with…arrow_forwardQuestion 1 For each of these situations for part a, b, c, answer what happens to the list below. (increase, decrease, no change) with all other things constant. In addition draw the necessary Demand and Supply graph and show the shifts. Label all points on the graphs clearly. State for each market below what happens to: demand, supply, equilibrium price, equilibrium quantity, Quantity Demanded, Quantity Supplied How will a decrease in supply of Coffee affect the market for Coffee and Tea market? Assume substitute products. You need to show two markets, with two sets of the list. ? How will an increase in cost of plastic used in making toys affect the market for toys? How will the increase' Note:- Do not provide handwritten solution. Maintain accuracy and quality in your answer. Take care of plagiarism. Answer completely. You will get up vote for sure.arrow_forwarde Price -Q₁ Quantity Which of the following scenarios is BEST represented in the graph? A number of sellers increase B decrease in government taxes C resource costs increase D technology improvesarrow_forward
arrow_back_ios
SEE MORE QUESTIONS
arrow_forward_ios
Recommended textbooks for you
 Principles of Economics (12th Edition)EconomicsISBN:9780134078779Author:Karl E. Case, Ray C. Fair, Sharon E. OsterPublisher:PEARSON
 Engineering Economy (17th Edition)EconomicsISBN:9780134870069Author:William G. Sullivan, Elin M. Wicks, C. Patrick KoellingPublisher:PEARSON
 Principles of Economics (MindTap Course List)EconomicsISBN:9781305585126Author:N. Gregory MankiwPublisher:Cengage Learning
 Managerial Economics: A Problem Solving ApproachEconomicsISBN:9781337106665Author:Luke M. Froeb, Brian T. McCann, Michael R. Ward, Mike ShorPublisher:Cengage Learning
 Managerial Economics & Business Strategy (Mcgraw-...EconomicsISBN:9781259290619Author:Michael Baye, Jeff PrincePublisher:McGraw-Hill Education
Principles of Economics (12th Edition)
Economics
ISBN:9780134078779
Author:Karl E. Case, Ray C. Fair, Sharon E. Oster
Publisher:PEARSON
Engineering Economy (17th Edition)
Economics
ISBN:9780134870069
Author:William G. Sullivan, Elin M. Wicks, C. Patrick Koelling
Publisher:PEARSON
Principles of Economics (MindTap Course List)
Economics
ISBN:9781305585126
Author:N. Gregory Mankiw
Publisher:Cengage Learning
Managerial Economics: A Problem Solving Approach
Economics
ISBN:9781337106665
Author:Luke M. Froeb, Brian T. McCann, Michael R. Ward, Mike Shor
Publisher:Cengage Learning
Managerial Economics & Business Strategy (Mcgraw-...
Economics
ISBN:9781259290619
Author:Michael Baye, Jeff Prince
Publisher:McGraw-Hill Education