Related questions
Question
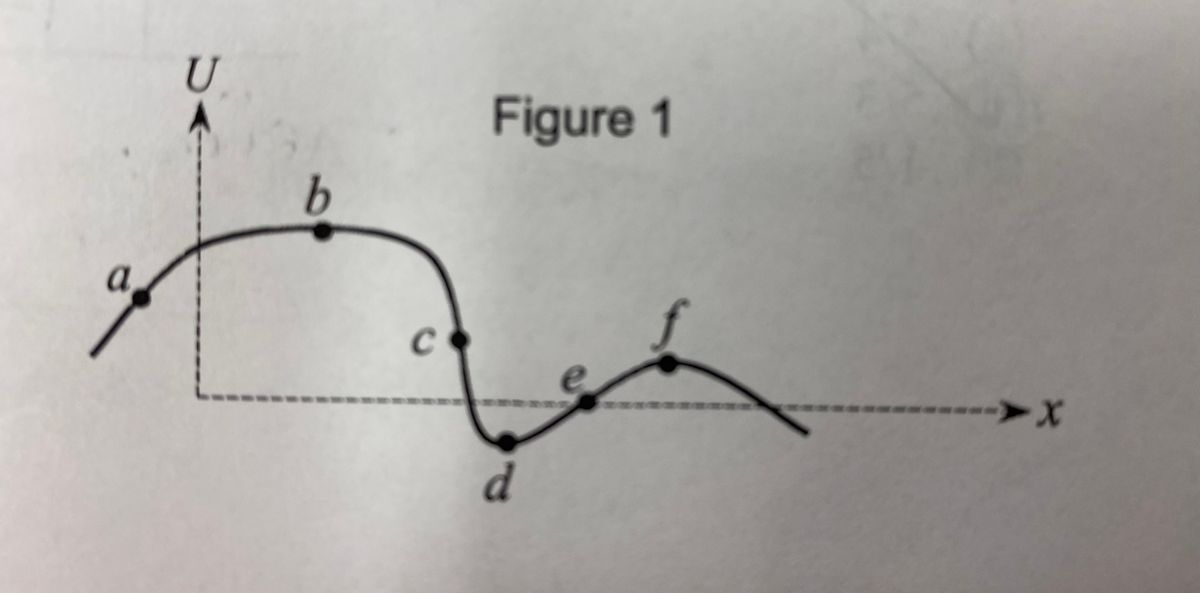
The potential energy of a particle varies with x as shown in Figure 1. At which point(s) does the force have the greatest magnitude? Choose all that apply.
(a) Point a
(b) Point b
(c) Point c
(d) Point d
(e) Point e
(f) Point f

Transcribed Image Text:**Figure 1: Graph of a Function**
The diagram presents a graph depicting a curve plotted over a two-dimensional coordinate system with axes labeled as \( U \) (vertical) and \( x \) (horizontal). Key points labeled on the curve include \( a \), \( b \), \( c \), \( d \), \( e \), and \( f \).
**Description:**
- The graph begins at point \( a \) at a low position on the vertical \( U \)-axis and rises to point \( b \), indicating an increase.
- From point \( b \), the curve descends through point \( c \) and further drops to point \( d \), reaching a lower position.
- The curve then ascends from point \( d \) to point \( e \), followed by another rise to point \( f \).
- Post point \( f \), the curve gradually declines.
This graph likely represents a function or a data set where the value \( U \) changes with respect to \( x \). Understanding the changes in the graph can elucidate trends or behaviors in specific contexts like physics, economics, or other fields of study.
Expert Solution
This question has been solved!
Explore an expertly crafted, step-by-step solution for a thorough understanding of key concepts.

This is a popular solution

Trending nowThis is a popular solution!

Step by stepSolved in 2 steps with 1 images

Knowledge Booster

Similar questions
- A 5.58 kg object falls freely (ignore air resistance), after being dropped from rest. Determine the initial kinetic energy (in J), the final kinetic energy (in J), and the change in kinetic energy (in J) for the following. (a) the first meter of the fall initial kinetic energy final kinetic energy change in kinetic energy (b) the second meter of the fall initial kinetic energy final kinetic energy change in kinetic energy J J Jarrow_forwardB The figure shows a potential well for a particle that can move along an x axis. Four regions of the graph are lettered. Rank those regions according to the magnitude of the force that would act on the particle if it is the region, greatest first. () indicates a tie. U (J) 40 30 20 10 0 2 OC, (A,D), B O A, B, D, C O (A,B,C,D) O C, B, A, D. OD, (B,C), A 4 B 6 7 C 9 12 x (m)arrow_forwardA particle moves along the x axis with the potential energy, U, shown. At x = 6m, what is the x component of the force on the particle? U (J) 20 15 10 0 -1.25 N Backup link to image (opens in new tab). 1.25 N -15 N 15 N -2.5 N 2 2.5 N 6 10 x(m)arrow_forward
- The figure shows four situations where a force F is applied to the same block. In each case the force has the same magnitude, and the displacement of the block in each case is the same (marked as Delta(x)) - to the right with the same magnitude.Rank the four situations in order of the work done by the force F on the block, from most positive to most negative. A) c,a,d,b B) b,d,a,c C) The Force does the same work on the block in all four situations. D) C,b,a,darrow_forwardA system in which only one particle can move has the potential energy shown in (Figure 1). Suppose U₁ = 80 J. Figure U (J) U₁ 0 1 2 T 3 4 5 y (m) 1 of 1 Part A What is the y-component of the force on the particle at y = 0.5 m ? Express your answer with the appropriate units. Fy = Submit Part B Fy = Submit μA Value Request Answer What is the y-component of the force on the particle at y = 4 m? Express your answer with the appropriate units. Provide Feedback μà Value Units Request Answer ? Units ?arrow_forwardarrow_forward
- Please explain An electrically charged particle is held fixed at the origin. Let V = 1/r be the potential energy of a second particle with unit electric charge located at (x, y, z), where r = sqrt(x^2 + y^2 + z^2). The force on this second particle is given by −∇V . Calculate the force on the particle when it is at (1, 2, −2). Show workingarrow_forwardHello, can you help me with this problem please? Thank youarrow_forwardThe potential energy of a system is given by: U(x,y,z)=5(J/m^2) x^2 + 7(J/m^3) xy^2 + 8(J/m^2) zy Find: The force acting on the system. Write the forces as the sum of its components. The magnitude of the force when x=1, y=0, z=2arrow_forward
- If the net work done by the force is 4 Joules, what is the value for z in the attached graph?arrow_forwardA particle is acted on by the constant force F = (8.00î + 1.00ĵ) N as it moves from position O to C along several different paths shown in the figure below. Determine the work done on the object by the force as the object moves from position O to C along the following paths. (Include the sign of the values in your answers.) (a) path OAC J(b) path OBC J(c) path OC J(d) From the above, we may conclude that the given force is which of the following? not a conservative force There is not enough information to tell. a conservative forcearrow_forwardThe graph shows the potential energy as a function of distance for an object moving along the x axis. At which of the labeled points does the force acting on the object have the largest magnitude? А В E C а. b. B С. C d. D е. Е a.arrow_forward
arrow_back_ios
SEE MORE QUESTIONS
arrow_forward_ios