
MATLAB: An Introduction with Applications
6th Edition
ISBN: 9781119256830
Author: Amos Gilat
Publisher: John Wiley & Sons Inc
expand_more
expand_more
format_list_bulleted
Related questions
Concept explainers
Question
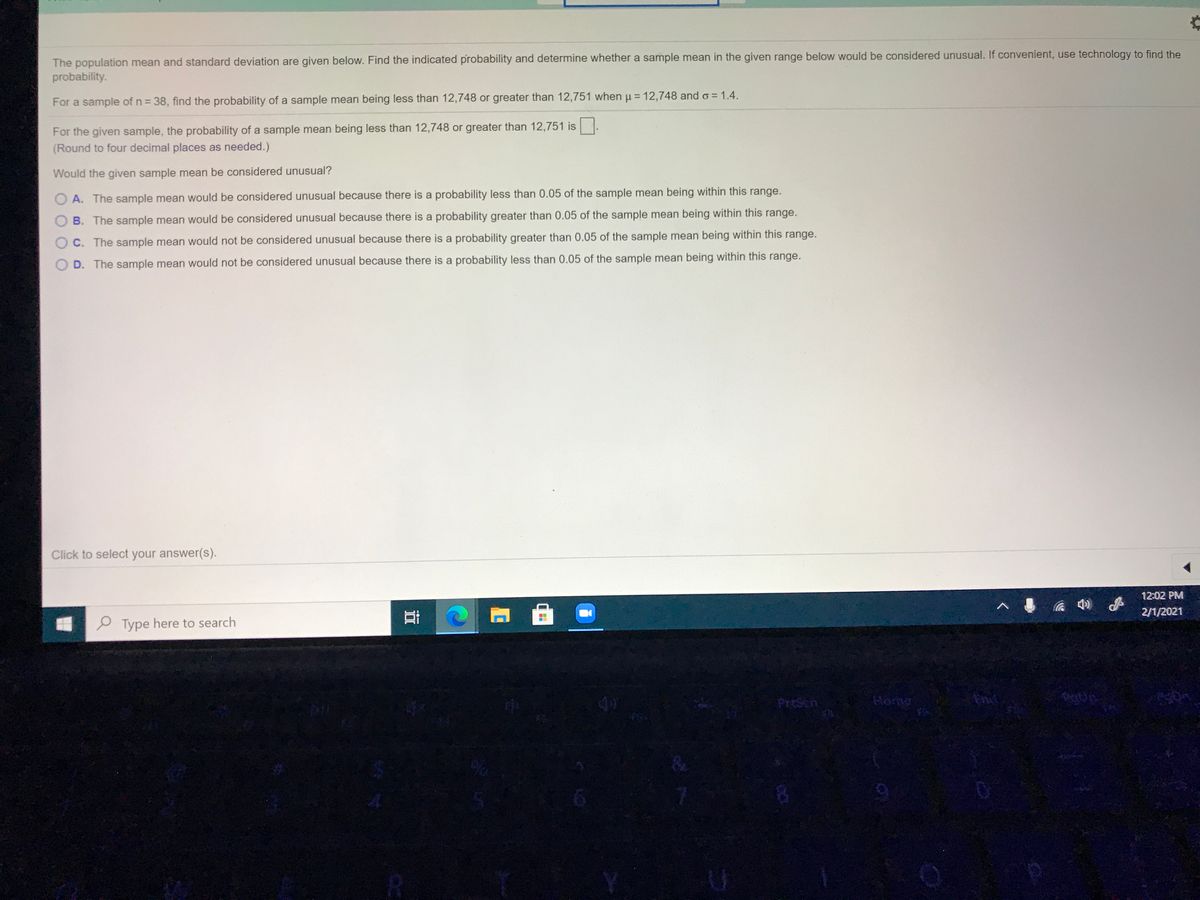

Transcribed Image Text:The population mean and standard deviation are given below. Find the indicated probability and determine whether a sample mean in the given range below would be considered unusual. If convenient, use technology to find the
probability.
%3D
For a sample of n = 38, find the probability of a sample mean being less than 12,748 or greater than 12,751 when u = 12,748 and o = 1.4.
For the given sample, the probability of a sample mean being less than 12,748 or greater than 12,751 is.
(Round to four decimal places as needed.)
Would the given sample mean be considered unusual?
A. The sample mean would be considered unusual because there is a probability less than 0.05 of the sample mean being within this range.
B. The sample mean would be considered unusual because there is a probability greater than 0.05 of the sample mean being within this range.
O C. The sample mean would not be considered unusual because there is a probability greater than 0.05 of the sample mean being within this range.
D. The sample mean would not be considered unusual because
is a probability less than 0.05 of the sample mean being within this range.
Click to select your answer(s).
12:02 PM
2/1/2021
e Type here to search
Presch
End
Expert Solution
This question has been solved!
Explore an expertly crafted, step-by-step solution for a thorough understanding of key concepts.

This is a popular solution

Trending nowThis is a popular solution!

Step by stepSolved in 3 steps

Knowledge Booster


Learn more about
Need a deep-dive on the concept behind this application? Look no further. Learn more about this topic, statistics and related others by exploring similar questions and additional content below.Similar questions
- In the 1992 presidential election, Alaska's 40 election districts averaged 2008 votes per district for President Clinton. The standard deviation was 573. (There are only 40 election districts in Alaska.) The distribution of the votes per district for President Clinton was bell-shaped. Let X = number of votes for President Clinton for an election district. (Source: The World Almanac and Book of Facts) Round all answers except part e. to 4 decimal places.a. Find the probability that a randomly selected district had fewer than 2096 votes for President Clinton. b. Find the probability that a randomly selected district had between 2047 and 2177 votes for President Clinton.c. Find the third quartile for votes for President Clinton. Round your answer to the nearest whole number.arrow_forwardPlease answer within 30min thanks.arrow_forwardCody took his first physics exam and scored an 80. The population mean for this exam is 70, and the standard deviation is 5. What is the probability of selecting a person with a score greater than Cody’s?arrow_forward
- Please see pictures for details of question.arrow_forwardThe population mean and standard deviation are given below. Find the required probability and determine whether the given sample mean would be considered unusual. For a sample of n = 63, find the probability of a sample mean being less than 19.5 if u = 20 and o=1.33. Click the icon to view page 1 of the standard normal table. Click the icon to view page 2 of the standard normal table. For a sample of n = 63, the probability of a sample mean being less than 19.5 if u = 20 and σ = 1.33 is (Round to four decimal places as needed.) Would the given sample mean be considered unusual? The sample mean be considered unusual because it has a probability that is than 5%.arrow_forwardQ6. Select the best response. The sampling distribution of the mean will be approximately Normaleven when the population is not exactly Normal as long as the sample is: A. medium B. large C. smallarrow_forward
arrow_back_ios
arrow_forward_ios
Recommended textbooks for you
- MATLAB: An Introduction with ApplicationsStatisticsISBN:9781119256830Author:Amos GilatPublisher:John Wiley & Sons Inc
 Probability and Statistics for Engineering and th...StatisticsISBN:9781305251809Author:Jay L. DevorePublisher:Cengage Learning
 Statistics for The Behavioral Sciences (MindTap C...StatisticsISBN:9781305504912Author:Frederick J Gravetter, Larry B. WallnauPublisher:Cengage Learning
  Elementary Statistics: Picturing the World (7th E...StatisticsISBN:9780134683416Author:Ron Larson, Betsy FarberPublisher:PEARSON
 The Basic Practice of StatisticsStatisticsISBN:9781319042578Author:David S. Moore, William I. Notz, Michael A. FlignerPublisher:W. H. Freeman
 Introduction to the Practice of StatisticsStatisticsISBN:9781319013387Author:David S. Moore, George P. McCabe, Bruce A. CraigPublisher:W. H. Freeman
MATLAB: An Introduction with Applications
Statistics
ISBN:9781119256830
Author:Amos Gilat
Publisher:John Wiley & Sons Inc
Probability and Statistics for Engineering and th...
Statistics
ISBN:9781305251809
Author:Jay L. Devore
Publisher:Cengage Learning
Statistics for The Behavioral Sciences (MindTap C...
Statistics
ISBN:9781305504912
Author:Frederick J Gravetter, Larry B. Wallnau
Publisher:Cengage Learning
Elementary Statistics: Picturing the World (7th E...
Statistics
ISBN:9780134683416
Author:Ron Larson, Betsy Farber
Publisher:PEARSON
The Basic Practice of Statistics
Statistics
ISBN:9781319042578
Author:David S. Moore, William I. Notz, Michael A. Fligner
Publisher:W. H. Freeman
Introduction to the Practice of Statistics
Statistics
ISBN:9781319013387
Author:David S. Moore, George P. McCabe, Bruce A. Craig
Publisher:W. H. Freeman