MATLAB: An Introduction with Applications
6th Edition
ISBN: 9781119256830
Author: Amos Gilat
Publisher: John Wiley & Sons Inc
expand_more
expand_more
format_list_bulleted
Question

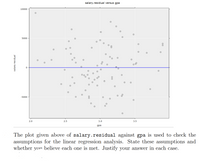
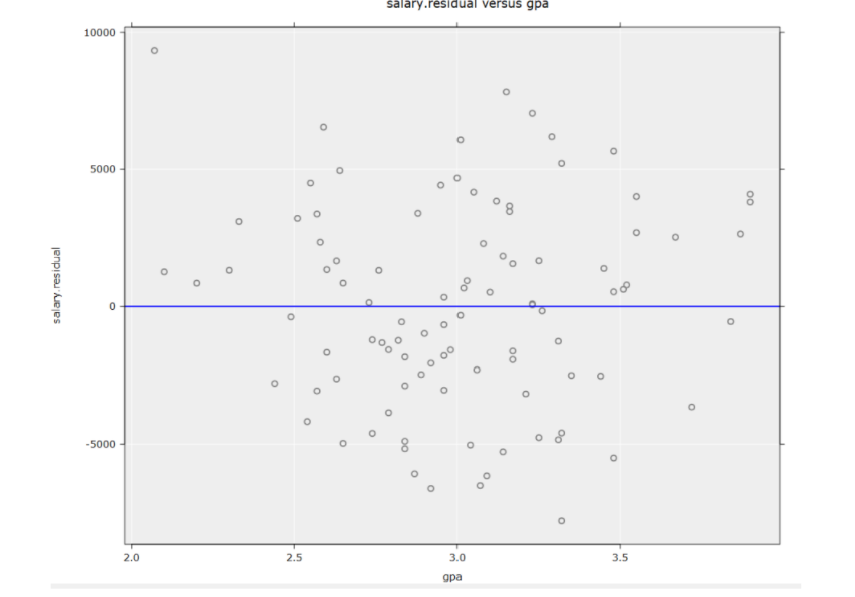
Transcribed Image Text:salary.residual versus gpa
10000
5000
-5000
2.0
2.5
3.0
3.5
gpa
The plot given above of salary.residual against gpa is used to check the
assumptions for the linear regression analysis. State these assumptions and
whether you believe each one is met. Justify your answer in each case.
salary.residual
Expert Solution
arrow_forward
Step 1
The residual plot given is shown below

gpa is the independent variable
salary is dependent variable.
Step by stepSolved in 2 steps with 1 images

Knowledge Booster
Similar questions
- The accompanying data are the number of wins and the earned run averages (mean number of earned runs allowed per nine innings pitched) for eight baseball pitchers in a recent season. Find the equation of the regression line. Then construct a scatter plot of the data and draw the regression line. Then use the regression equation to predict the value of y for each of the given x-values, if meaningful. If the x-value is not meaningful to predict the value of y, explain why not. (a) x = 5 wins Click the icon to view the table of numbers of wins and earned run average. (b) x = 10 wins (c) x = 21 wins (d) x = 15 wins ERA 6- ERA 6- AERA 6- ERA 6- 4- 4- 4- 4- 2- 2- 2- 2- 0+ 6 0- 0- 0- 12 18 24 6. 12 18 24 12 18 24 6 12 18 24 Wins Wins Wins Wins (a) Predict the ERA for 5 wins, if it is meaningful. Select the correct choice below and, if necessary, fill in the answer box within your choice. A. ŷ= (Round to two decimal places as needed.) B. It is not meaningful to predict this value of y because…arrow_forwardThis question has do with linear regression.If I consider attendance in a class versus final grade in the class can you explain where there is a positive and when there is a negative relationship between them.arrow_forwardPlease work this problem for me. Thank youarrow_forward
- Two variables are defined, a regression equation is given, and one data point is given. Weight Training = = Weight 92 +11.9(Training) = maximum weight capable of bench pressing (pounds) number of hours spent lifting weights a week The data point is an individual who trains 5 hours a week and can bench 150 pounds. Residual (a) Find the predicted value for the data point and compute the residual. Enter the exact answers. Predicted value = M. lbs lbsarrow_forwardRefer to the Baseball 2018 data, which reports information on the 2018 Major League Baseball season. Let attendance be the dependent variable and total team salary be the independent variable. Determine the regression equation and answer the following questions. Click here for the Excel Data Filea-1. Draw a scatter diagram.1. On the graph below, use the point tool to plot the point corresponding to the Attendance and its team salary (Salary 1).2. Repeat the process for the remainder of the sample Salary 2, Salary 3, … ).3. To enter exact coordinates, double-click on the point and enter the exact coordinates of x and y. a-2. From the diagram, does there seem to be a direct relationship between the two variables?multiple choice 1 Yes No b. What is the expected attendance for a team with a salary of $100.0 million? (Round your answer to 4 decimal places.) c. If the owners pay an additional $30 million, how many more people could they expect to attend? (Round your answer to 3…arrow_forwardWrite out the full linear model including all dummy variables below. Don’t worry about estimating regression coefficients just yet. Feel free to abbreviate variable names so long as they are clearly distinguishable.arrow_forward
- Use Excel to Run the Regressions:1. Wage and Age: Do you think a worker’s wage is related to his/her age? It is expected that wagesincrease with age up to certain age, after that wages go down. The “Wage Quadratic Data” fileposted contains data on the hourly wage (in $) for construction workers, workers’ ageand whether the worker has a bachelor’s degree or not (Graduate equals 1 if the worker has abachelor’s degree and 0 otherwise). Use the data file to answer the following questions:A) Build a model to predict the hourly wage of construction workers based on their education andage.B) Use the model to predict the hourly wage for a college graduate construction worker if his/herage is 30, 50, and 70c) Based on your model, calculate the age at which the hourly wage for construction workers ismaximized.arrow_forwardThe table below shows the average weekly wages (in dollars) for state government employees and federal government employees for 10 years. Construct and interpret a 99% prediction interval for the average weekly wages of federal government employees when the average weekly wages of state government employees is $925. The equation of the regression line isarrow_forwardThe accompanying data are the number of wins and the earned run averages (mean number of earned runs allowed per nine innings pitched) for eight baseball pitchers in a recent season. Find the equation of the regression line. Then construct a scatter plot of the data and draw the regression line. Then use the regression equation to predict the value of y for each of the given x-values, if meaningful. If the x-value is not meaningful to predict the value of y, explain why not. (a) x = 5 wins Click the icon to view the table of numbers of wins and earned run average. (b) x= 10 wins (c) x=21 wins (d) x= 15 wins The equation of the regression line is y = x+ | (Round to two decimal places as needed.) !!arrow_forward
arrow_back_ios
arrow_forward_ios
Recommended textbooks for you
 MATLAB: An Introduction with ApplicationsStatisticsISBN:9781119256830Author:Amos GilatPublisher:John Wiley & Sons Inc
 Probability and Statistics for Engineering and th...StatisticsISBN:9781305251809Author:Jay L. DevorePublisher:Cengage Learning
 Statistics for The Behavioral Sciences (MindTap C...StatisticsISBN:9781305504912Author:Frederick J Gravetter, Larry B. WallnauPublisher:Cengage Learning
 Elementary Statistics: Picturing the World (7th E...StatisticsISBN:9780134683416Author:Ron Larson, Betsy FarberPublisher:PEARSON
 The Basic Practice of StatisticsStatisticsISBN:9781319042578Author:David S. Moore, William I. Notz, Michael A. FlignerPublisher:W. H. Freeman
 Introduction to the Practice of StatisticsStatisticsISBN:9781319013387Author:David S. Moore, George P. McCabe, Bruce A. CraigPublisher:W. H. Freeman

MATLAB: An Introduction with Applications
Statistics
ISBN:9781119256830
Author:Amos Gilat
Publisher:John Wiley & Sons Inc

Probability and Statistics for Engineering and th...
Statistics
ISBN:9781305251809
Author:Jay L. Devore
Publisher:Cengage Learning

Statistics for The Behavioral Sciences (MindTap C...
Statistics
ISBN:9781305504912
Author:Frederick J Gravetter, Larry B. Wallnau
Publisher:Cengage Learning

Elementary Statistics: Picturing the World (7th E...
Statistics
ISBN:9780134683416
Author:Ron Larson, Betsy Farber
Publisher:PEARSON

The Basic Practice of Statistics
Statistics
ISBN:9781319042578
Author:David S. Moore, William I. Notz, Michael A. Fligner
Publisher:W. H. Freeman

Introduction to the Practice of Statistics
Statistics
ISBN:9781319013387
Author:David S. Moore, George P. McCabe, Bruce A. Craig
Publisher:W. H. Freeman