
MATLAB: An Introduction with Applications
6th Edition
ISBN: 9781119256830
Author: Amos Gilat
Publisher: John Wiley & Sons Inc
expand_more
expand_more
format_list_bulleted
Related questions
Question
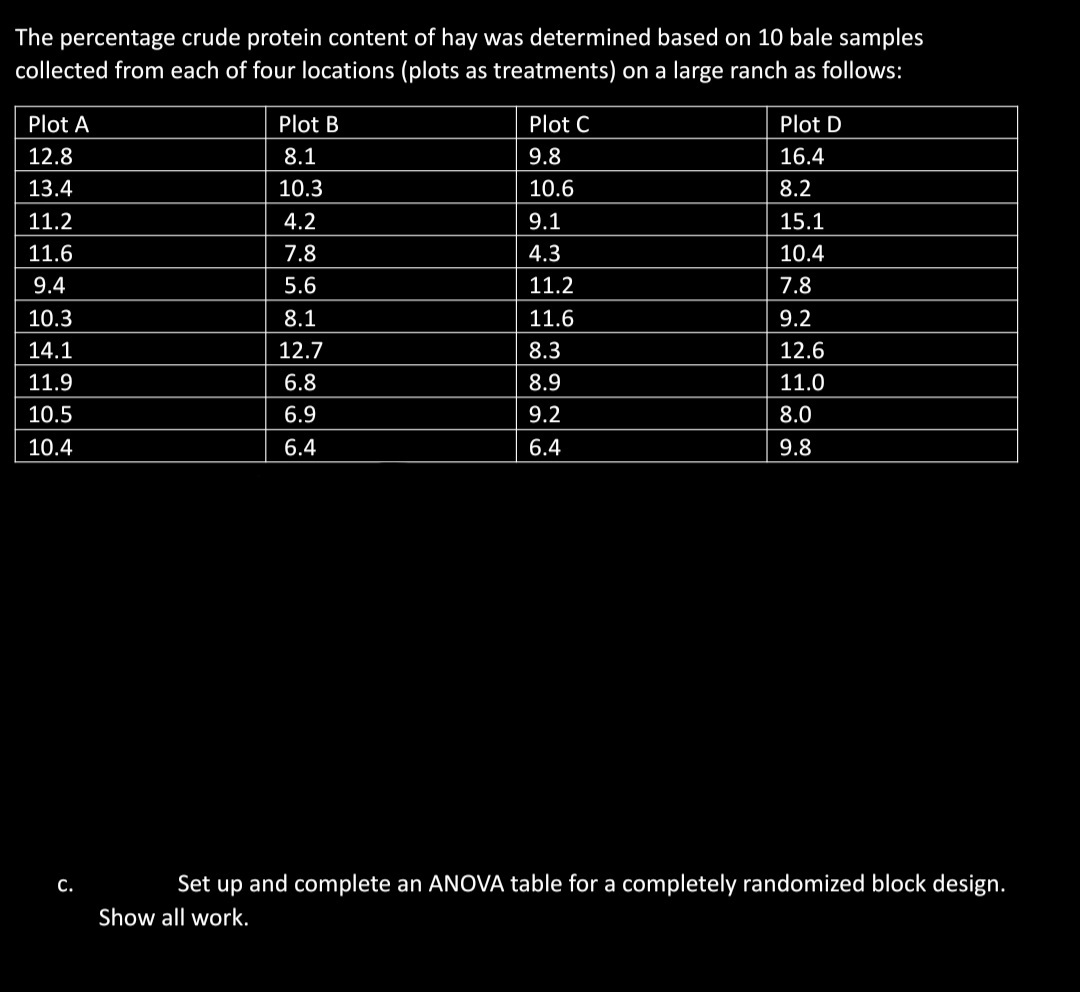

Transcribed Image Text:The percentage crude protein content of hay was determined based on 10 bale samples
collected from each of four locations (plots as treatments) on a large ranch as follows:
Plot A
12.8
13.4
11.2
11.6
9.4
10.3
14.1
11.9
10.5
10.4
C.
Plot B
8.1
10.3
4.2
7.8
5.6
8.1
12.7
6.8
6.9
6.4
Plot C
9.8
10.6
9.1
4.3
11.2
11.6
8.3
8.9
9.2
6.4
Plot D
16.4
8.2
15.1
10.4
7.8
9.2
12.6
11.0
8.0
9.8
Set up and complete an ANOVA table for a completely randomized block design.
Show all work.
Expert Solution
This question has been solved!
Explore an expertly crafted, step-by-step solution for a thorough understanding of key concepts.

Step by stepSolved in 4 steps with 20 images

Knowledge Booster

Similar questions
- Total plasma volume is important in determining the required plasma component in blood replacement therapy for a person undergoing surgery. Plasma volume is influenced by the overall health and physical activity of an individual. Suppose that a random sample of 40 male firefighters are tested and that they have a plasma volume sample mean of x = 37.5 ml/kg (milliliters plasma per kilogram body weight). Assume that o = 7.10 ml/kg for the distribution of blood plasma. When finding an 99% confidence interval, what is the critical value for confidence level? (Give your answer to two decimal places.) (a) Find a 99% confidence interval for the population mean blood plasma volume in male firefighters. What is the margin of error? (Round your answers to two decimal places.) lower limit upper limit margin of error (b). What conditions are necessary for your calculations? (Select all that apply.) n is large the distribution of volumes is normal o is unknown the distribution of volumes is uniform…arrow_forward18. We want to study the relationship between size (sq. m) and the price of houses. We randomly chose 25 houses and recorded the size and price of them. The excel output for the data is given below: Regression statistics: Multiple R: 0.586378154 R Square: 0.343839339 Adjusted R Square: 0.315310615 Standard Error: 34761.73162 Observations: 25 df SS MS F SignificanceF Regression 1 14563843876 1.46E+10 12.05239 0.0020659 Residual 23 27792693660 1.21E+09 Total 24 42356537536 Coefficients StandardError T stat P-value lower95% upper95% Lower95.0% upper95.0% Intercept 189769.0334 28557.61831 6.645128 8.85E-07 130693.1 248844.968 130693.1 248844.968 Size (sq.meter) 444.1951525 127.9490924 3.471655 0.002066 179.51229 708.878016 179.51229 708.878016 Write down your answers to (a)-(c) in the box below. Give your answers to 4 decimal places. Write down 95% confidence interval for the slope of the relationship between price and size. We want to…arrow_forwardThe given data are for cost, in cents, to print one page of text for 20 printers. a) Find the percentile corresponding to 5.4 b) Find the percentile corresponding to 3.5 c) Find the percetile corresponding to 3.2 Show your work.arrow_forward
- Perform PCA or principle component analysis on the following data: х1 x2 x3 810.6 13.4 42.93 1775 24.2 32.319 430.4 5.7 60.434 459.8 9 21.398 802.4 13.9 55.778 279.6 20.4 53.236 288.4 4.6 63.208 152.7 7.3 59.727 253.4 9.9 48.037 358.6 13.5 48.288 72 12.8 36.507 205 5.9 37.195 253.6 15.8 36.964 416.5 12.3 42.83 1075.9 17.1 39.684 Answer the following questions based on the PCA: • How many principle components were created? • What percent of total variance is accounted for by the calculated principal components? (Round to 2 decimal places) • What are the weights for computing the first principle component scores? (Round to 4 decimal places) o x1: • x2: o x3:arrow_forwardThe weight percent of silicon in six different rock samples, each containing different amounts of silicon, was measured by two different methods. The results are given in the table. Sample Method A Si wt% Method B Si wt% 1 11.570 11.500 2 15.380 15.300 3 17.950 17.830 4 22.840 22.810 5 25.110 25.150 6 27.070 27.040 Determine tcalc. tcalc = Determine ttable at the 95% confidence level. A list of t values can be found in the Student's t table. ttable =arrow_forwardAn article discussed the opening of a Market. The following data compared the prices of some kitchen staples at the new Market (group 1) and at the old Market (group 2) located 15 blocks away. ITEM GROUP 1 GROUP 2 HALF GALLON MILK 16.8 22.0 DOZEN EGGS 11.7 15.2 ORANGE JUICE (64OZ) 15.6 18.7 HEAD OF LETTUCE 16.7 15.6 1LB GROUND BEEF 17.5 20.8 6OZ TUNA 18.1 19.5 1LB APPLES 14.1 17.0 LINGUINI 21.8 19.5 SALMON STEAK 1LB 13.9 16.5 WHOLE CHICKEN PER LB 20.8 24.0 A. Use math symbol to formulate null hypothesis and alternative hypothesis to test whether there is evidence that the mean price is lower at Group 1 or Group 2. (use without calculator functions)arrow_forward
- Suppose samples of six different brands of diet or imitation margarine were analyzed to determine the level of physiologically active polyunsaturated fatty acids (PAPUFA, in percent), resulting in the data shown in the accompanying table. Imperial 14.1 13.6 14.6 14.3 Parkay 12.8 12.5 13.6 13.0 12.3 Blue Bonnet 13.5 13.4 14.1 14.5 Chiffon 13.2 12.7 12.6 14 Mazola 16.8 17.3 16.4 17.3 18.0 Fleischmann's 18.1 17.2 18.8 18.4 (a) Test for differences among the true means for PAPUFA percentages among the different brands. Use ? = 0.05. Calculate the test statistic. (Round your answer to two decimal places.) F = Use technology to find the P-value. (Round your answer to four decimal places.) P-value = What can you conclude? Reject H0. There is convincing evidence that the mean PAPUFA percentages for the six brands are not all equal.Fail to reject H0. There is convincing evidence that the mean PAPUFA percentages for the six brands are not all equal. Reject…arrow_forwardHere are some data on the heights of giraffe. Calculate a 100% CI: 3.6 3.7 3.8 3.8 4.1 4.2 4.2 4.2 4.2 4.5 4.6 5.1 Some possibly useful statistics: = 4.167, s = 0.4250arrow_forwardThe percentage crude protein content of hay was determined based on 10 bale samples collected from each of four locations (plots as treatments) on a large ranch as follows: Plot A 12.8 13.4 11.2 11.6 9.4 10.3 14.1 11.9 10.5 10.4 b. Plot B 8.1 10.3 4.2 7.8 5.6 8.1 12.7 6.8 6.9 6.4 Plot C 9.8 10.6 9.1 4.3 11.2 11.6 8.3 8.9 9.2 6.4 Plot D 16.4 8.2 15.1 10.4 7.8 9.2 12.6 11.0 8.0 9.8 Set up and complete an ANOVA table for a one-way analysis. Show all work.arrow_forward
- The duration (in minutes) for a sample of 20 flight-reservation telephone calls is shown in the following table: 2.1 10.4 4.8 5.5 4.5 2.8 5.9 10.5 4.8 3.3 5.8 6.6 7.5 4.8 5.5 3.5 5.3 3.6 7.8 6.0 NOTE: Ex=111 and x = 709.82 Assuming the population has a normal distribution, find a 95% confidence interval for the population mean time.arrow_forwardThe following data (see photo) represent the weights (in grams) of random sample of 50 M&M plain candies. Determine the actual percentage of M&Ms that weigh more than 0.911 gram.arrow_forwardListed below are the measured radiation absorption rates (in W. 5-number summary. 1.12 0.52 0.51 0.92 0.7arrow_forward
arrow_back_ios
SEE MORE QUESTIONS
arrow_forward_ios
Recommended textbooks for you
- MATLAB: An Introduction with ApplicationsStatisticsISBN:9781119256830Author:Amos GilatPublisher:John Wiley & Sons Inc
 Probability and Statistics for Engineering and th...StatisticsISBN:9781305251809Author:Jay L. DevorePublisher:Cengage Learning
 Statistics for The Behavioral Sciences (MindTap C...StatisticsISBN:9781305504912Author:Frederick J Gravetter, Larry B. WallnauPublisher:Cengage Learning
  Elementary Statistics: Picturing the World (7th E...StatisticsISBN:9780134683416Author:Ron Larson, Betsy FarberPublisher:PEARSON
 The Basic Practice of StatisticsStatisticsISBN:9781319042578Author:David S. Moore, William I. Notz, Michael A. FlignerPublisher:W. H. Freeman
 Introduction to the Practice of StatisticsStatisticsISBN:9781319013387Author:David S. Moore, George P. McCabe, Bruce A. CraigPublisher:W. H. Freeman
MATLAB: An Introduction with Applications
Statistics
ISBN:9781119256830
Author:Amos Gilat
Publisher:John Wiley & Sons Inc
Probability and Statistics for Engineering and th...
Statistics
ISBN:9781305251809
Author:Jay L. Devore
Publisher:Cengage Learning
Statistics for The Behavioral Sciences (MindTap C...
Statistics
ISBN:9781305504912
Author:Frederick J Gravetter, Larry B. Wallnau
Publisher:Cengage Learning
Elementary Statistics: Picturing the World (7th E...
Statistics
ISBN:9780134683416
Author:Ron Larson, Betsy Farber
Publisher:PEARSON
The Basic Practice of Statistics
Statistics
ISBN:9781319042578
Author:David S. Moore, William I. Notz, Michael A. Fligner
Publisher:W. H. Freeman
Introduction to the Practice of Statistics
Statistics
ISBN:9781319013387
Author:David S. Moore, George P. McCabe, Bruce A. Craig
Publisher:W. H. Freeman