
MATLAB: An Introduction with Applications
6th Edition
ISBN: 9781119256830
Author: Amos Gilat
Publisher: John Wiley & Sons Inc
expand_more
expand_more
format_list_bulleted
Related questions
Question
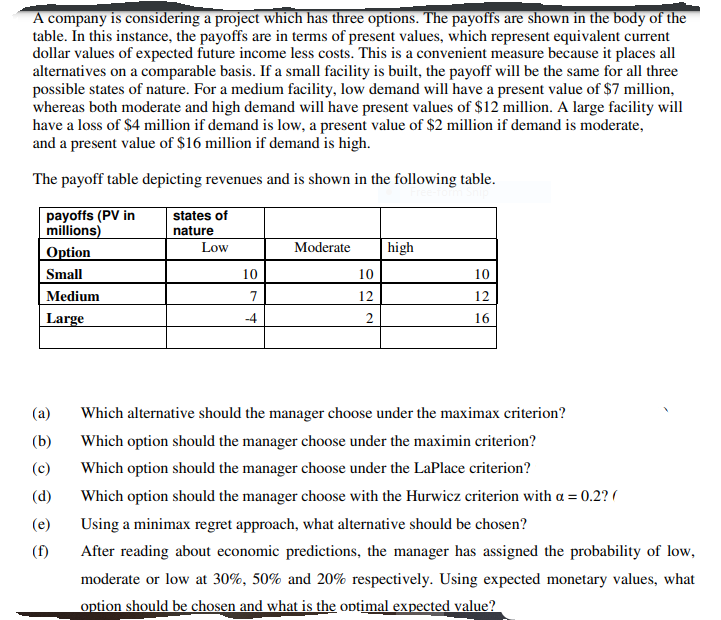

Transcribed Image Text:A company is considering a project which has three options. The payoffs are shown in the body of the
table. In this instance, the payoffs are in terms of present values, which represent equivalent current
dollar values of expected future income less costs. This is a convenient measure because it places all
alternatives on a comparable basis. If a small facility is built, the payoff will be the same for all three
possible states of nature. For a medium facility, low demand will have a present value of $7 million,
whereas both moderate and high demand will have present values of $12 million. A large facility will
have a loss of $4 million if demand is low, a present value of $2 million if demand is moderate,
and a present value of $16 million if demand is high.
The payoff table depicting revenues and is shown in the following table.
payoffs (PV in
millions)
states of
nature
Low
Option
Moderate
high
Small
10
10
10
Medium
7
12
12
Large
-4
2
16
(a)
Which alternative should the manager choose under the maximax criterion?
(b)
Which option should the manager choose under the maximin criterion?
(c)
Which option should the manager choose under the LaPlace criterion?
(d)
Which option should the manager choose with the Hurwicz criterion with a = 0.2? (
(e)
Using a minimax regret approach, what alternative should be chosen?
(f)
After reading about economic predictions, the manager has assigned the probability of low,
moderate or low at 30%, 50% and 20% respectively. Using expected monetary values, what
option should be chosen and what is the optimal expected value?
Expert Solution
This question has been solved!
Explore an expertly crafted, step-by-step solution for a thorough understanding of key concepts.

Step by stepSolved in 4 steps

Knowledge Booster

Similar questions
- Disposable income is the amount left after taxes have been paid and is one measure of health of the economy. The table gives the total disposable income for a country, in billions of dollars, for selected years from 2010 and projected to 2040. Year Income2010 10.5582015 11.5722020 12.3532025 14.7642030 15.3882035 17.8182040 19.183 b. Find a linear model that models the data, where x is the number of years after 2000 and y is the total disposable income in billions of dollars.arrow_forwardFor a particular red wine, the following data show the auction price for a 750-milliliter bottle and the age of the wine in June of 2016. Age (years) 37 20 29 33 41 26 29 45 34 22 Price ($) 256 142 217 255 331 168 209 297 237 182arrow_forwardAn article in Technometrics by S. C. Narula and J. F. Wellington (Prediction. Linear Regression and a Minimum Sum of Relative Errors." Vol. 19. 1977) presents data on the selling price (y) and annual taxes (x) for 24 houses. The taxes include local, school and county taxes. The data are shown in the table below. Calculate the least square estimates of slope and intercept. Sale Price/1000 Taxes/1000 ... 25.9 4.9176 29.5 5.0208 27.9 4.5429 4.5573 5.0597 3.8910 25.9 29.9 29.9 30.9 28.9 35.9 5.0980 5.6039 5.8282 31.5 5.3003 31.0 6.2712 30.9 5.9592 30.0 5.0500 36.9 8.2464 41.9 6.6909 40.5 7.7841 43.9 9.0384 37.5 5.9894 37.9 7.5422 44.5 8.7951 37.9 6.0831 34.9 8.3607 8.1400 26.9 45.8 9.1416 Input answers up to 3 decimal places. Slope 3.324 Intercept 13.320 Blank 1 3.324 Blank 2 13.320arrow_forward
- Population size (Thousands of Residents). Yearly Revenue, Y (Thousands of Dollars) The Tasty Sub Shop Revenue DataRestaurant Population Size, X1 Business Rating, X2 Yearly Revenue, Y 1 20.8 3 527.12 27.5 2 548.73 32.3 6 767.24 37.2 5 722.95 39.6 8 826.36 45.1 3 810.57 49.9 9 1040.58 55.4 5…arrow_forwardQuestion Determine the quadratic regression for the data set below. (2, 762), (5, 939), (7, 1177), (10, 1714), (12, 2192), (15, 3089) Select the correct answer below: O -12x – 25x – 764 O 12x? + 25.x + 764 O 12x2 – 25x – 764 O 12x2 – 25x + 764 O EEEDRACK MORE INSTRUCTION SURMITarrow_forward
arrow_back_ios
arrow_forward_ios
Recommended textbooks for you
- MATLAB: An Introduction with ApplicationsStatisticsISBN:9781119256830Author:Amos GilatPublisher:John Wiley & Sons Inc
 Probability and Statistics for Engineering and th...StatisticsISBN:9781305251809Author:Jay L. DevorePublisher:Cengage Learning
 Statistics for The Behavioral Sciences (MindTap C...StatisticsISBN:9781305504912Author:Frederick J Gravetter, Larry B. WallnauPublisher:Cengage Learning
  Elementary Statistics: Picturing the World (7th E...StatisticsISBN:9780134683416Author:Ron Larson, Betsy FarberPublisher:PEARSON
 The Basic Practice of StatisticsStatisticsISBN:9781319042578Author:David S. Moore, William I. Notz, Michael A. FlignerPublisher:W. H. Freeman
 Introduction to the Practice of StatisticsStatisticsISBN:9781319013387Author:David S. Moore, George P. McCabe, Bruce A. CraigPublisher:W. H. Freeman
MATLAB: An Introduction with Applications
Statistics
ISBN:9781119256830
Author:Amos Gilat
Publisher:John Wiley & Sons Inc
Probability and Statistics for Engineering and th...
Statistics
ISBN:9781305251809
Author:Jay L. Devore
Publisher:Cengage Learning
Statistics for The Behavioral Sciences (MindTap C...
Statistics
ISBN:9781305504912
Author:Frederick J Gravetter, Larry B. Wallnau
Publisher:Cengage Learning
Elementary Statistics: Picturing the World (7th E...
Statistics
ISBN:9780134683416
Author:Ron Larson, Betsy Farber
Publisher:PEARSON
The Basic Practice of Statistics
Statistics
ISBN:9781319042578
Author:David S. Moore, William I. Notz, Michael A. Fligner
Publisher:W. H. Freeman
Introduction to the Practice of Statistics
Statistics
ISBN:9781319013387
Author:David S. Moore, George P. McCabe, Bruce A. Craig
Publisher:W. H. Freeman