
MATLAB: An Introduction with Applications
6th Edition
ISBN: 9781119256830
Author: Amos Gilat
Publisher: John Wiley & Sons Inc
expand_more
expand_more
format_list_bulleted
Related questions
Question
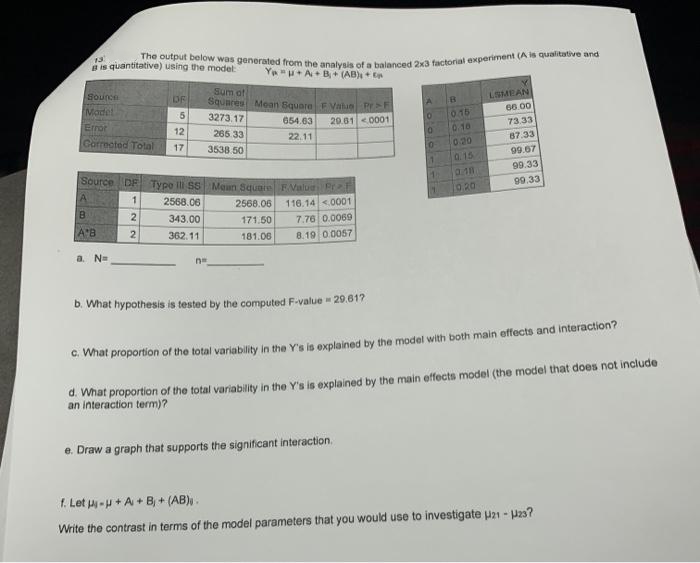

Transcribed Image Text:The output below was generated from the analysis of a balanced 2x3 factorial experiment (A is qualitative and
13
8 is quantitative) using the modet
Ya"u+A+ B+ (AB)+
Sum ot
Squares Moan Square F Vatun Pr>F
Sounce
DE
LSMEAN
Madel
Error
Corrected Total
3273.17
0.15
66.00
654.63
20.61 <0001
12
265 33
0.10
73.33
22.11
17
87.33
3538.50
020
99.67
0.15
Source DF Type ili ss Meun Square F Value Pr
99.33
0.11
99.33
1.
(020
2568.06
116.14 <0001
7.76 0.0069
8.19 0.0057
2568.06
343.00
171.50
A*B
362.11
181.06
a. N=
b. What hypothesis is tested by the computed F-value 29.61?
e. What proportion of the total variability in the Y's is explained by the model with both main effects and interaction?
d. What proportion of the total variability in the Y's is explained by the main effects model (the model that does not include
an interaction term)?
e. Draw a graph that supports the significant interaction.
1. Let u -H + A + B + (AB),.
Write the contrast in terms of the model parameters that you would use to investigate u21 -
Expert Solution
This question has been solved!
Explore an expertly crafted, step-by-step solution for a thorough understanding of key concepts.

Step by stepSolved in 4 steps with 1 images

Knowledge Booster

Similar questions
- A least squares regression was used to estimate the relationship between the dollar price P of 45 used 2001 Audi A4 2.8L sedans with manual transmission and the number of miles M the car had been driven: R = 0.70 P = 16,958 – 0.0677M, (2,553) (0.0233) The standard errors are in parentheses. a. Does the value 16,958 seem reasonable? b. Does the value –0.0677 seem reasonable? c. Does the value 0.70 seem reasonable? d. Is the estimated relationship between M and P statistically significant at the 5 percent level? e. Should the riables be reversed, wi M on the left-hand side and P on the right- hand side? Why or why not?arrow_forwardNA elered to in this question were collected on 16 commercial tires. The company is trying to measure tread wear t c tires using the weight method WM. The SAS regression output is given below as well as some summary measures: Analysis of Variance Sum of Source DF Mean Square F Value Pr > F Squares Model 84988 84988 It| Estimate Error Intercept 1 13.50586 21.04761 0.64 0.5314 WM 1 0.79021 0.07104 11.12 <0.0001 What is the equation of the least squares regression line? O9-0.79021 WM+ 13.50586 09.13.50586 WM + 0.79021 09-0.79021+13.50586 09-0.79021 WM 13.50586arrow_forwardCompute the predicted value of IPT for the mean value of PSS (static facial expressions (higher PSS)) The regression formula is: The terms of the equation and their values are:arrow_forward
- No idea how to do this, the data in the excel file is the same data shown on the screen. any help is appreciated :)arrow_forwardIn a study where the least squares estimates were based on 34 sets of sample observations, the total sum of squares and regression sum of squares were found to be: SST = 4.38 and SSR = 4.18. What is the error sum of squares? Multiple Choice 1.07 0.20 0.320 8.74arrow_forwardExplain whether homogeneity of variance is satisfied for this analysis, and be clear on how you decided this.arrow_forward
arrow_back_ios
arrow_forward_ios
Recommended textbooks for you
- MATLAB: An Introduction with ApplicationsStatisticsISBN:9781119256830Author:Amos GilatPublisher:John Wiley & Sons Inc
 Probability and Statistics for Engineering and th...StatisticsISBN:9781305251809Author:Jay L. DevorePublisher:Cengage Learning
 Statistics for The Behavioral Sciences (MindTap C...StatisticsISBN:9781305504912Author:Frederick J Gravetter, Larry B. WallnauPublisher:Cengage Learning
  Elementary Statistics: Picturing the World (7th E...StatisticsISBN:9780134683416Author:Ron Larson, Betsy FarberPublisher:PEARSON
 The Basic Practice of StatisticsStatisticsISBN:9781319042578Author:David S. Moore, William I. Notz, Michael A. FlignerPublisher:W. H. Freeman
 Introduction to the Practice of StatisticsStatisticsISBN:9781319013387Author:David S. Moore, George P. McCabe, Bruce A. CraigPublisher:W. H. Freeman
MATLAB: An Introduction with Applications
Statistics
ISBN:9781119256830
Author:Amos Gilat
Publisher:John Wiley & Sons Inc
Probability and Statistics for Engineering and th...
Statistics
ISBN:9781305251809
Author:Jay L. Devore
Publisher:Cengage Learning
Statistics for The Behavioral Sciences (MindTap C...
Statistics
ISBN:9781305504912
Author:Frederick J Gravetter, Larry B. Wallnau
Publisher:Cengage Learning
Elementary Statistics: Picturing the World (7th E...
Statistics
ISBN:9780134683416
Author:Ron Larson, Betsy Farber
Publisher:PEARSON
The Basic Practice of Statistics
Statistics
ISBN:9781319042578
Author:David S. Moore, William I. Notz, Michael A. Fligner
Publisher:W. H. Freeman
Introduction to the Practice of Statistics
Statistics
ISBN:9781319013387
Author:David S. Moore, George P. McCabe, Bruce A. Craig
Publisher:W. H. Freeman