
MATLAB: An Introduction with Applications
6th Edition
ISBN: 9781119256830
Author: Amos Gilat
Publisher: John Wiley & Sons Inc
expand_more
expand_more
format_list_bulleted
Related questions
Question
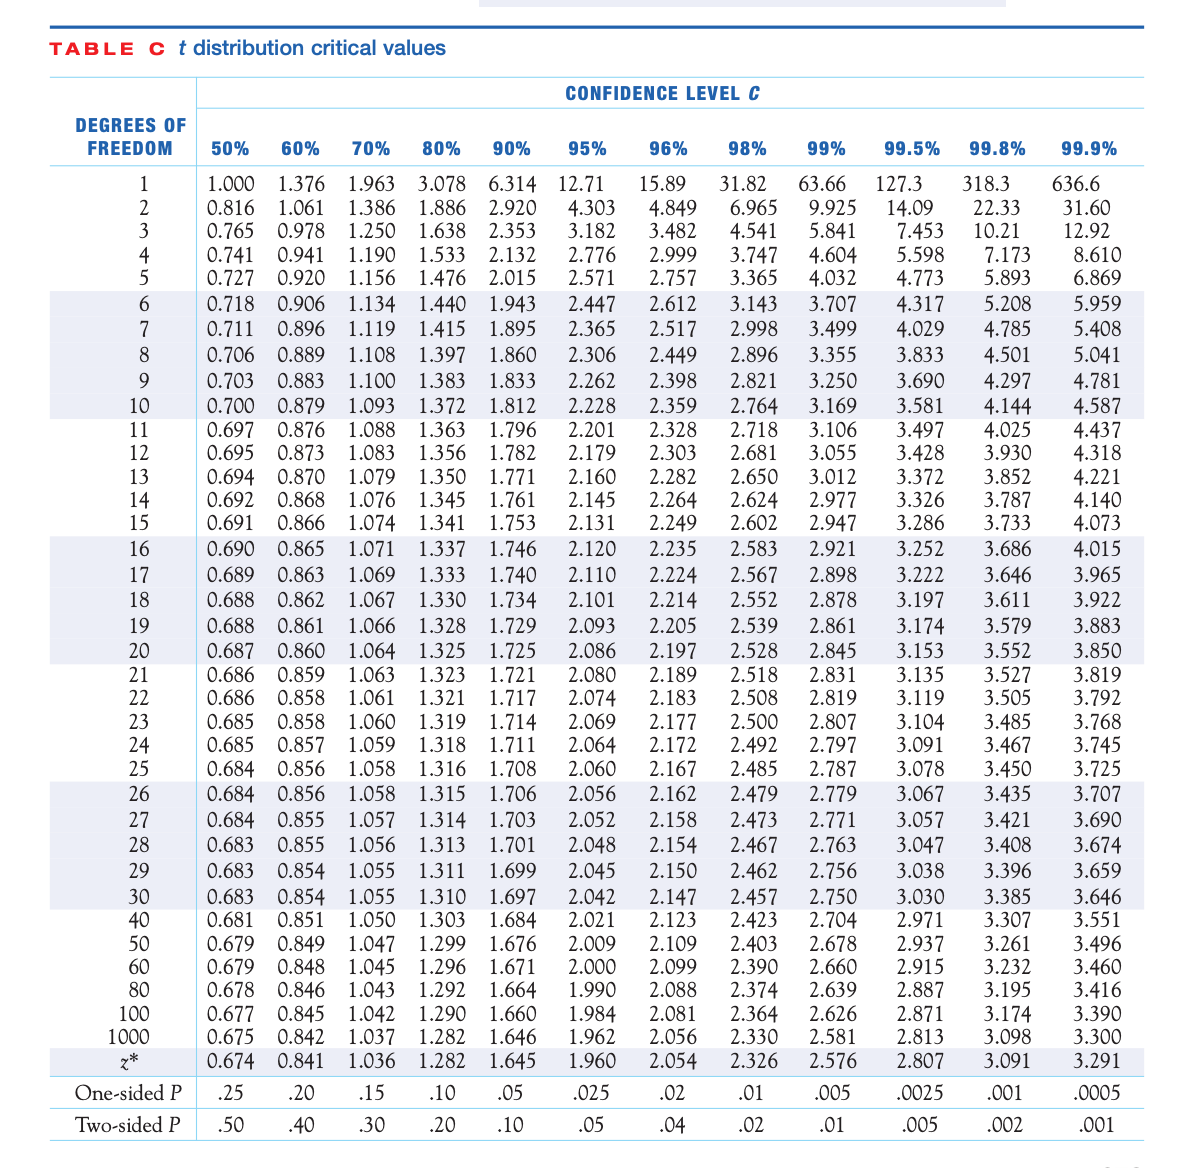

Transcribed Image Text:TABLE c t distribution critical values
CONFIDENCE LEVEL C
DEGREES OF
FREEDOM
50%
60%
70%
80%
90%
95%
96%
98%
99%
99.5%
99.8%
99.9%
1.376 1.963
1.386
1.250
15.89
4.849
3.482
318.3
3.078 6.314 12.71
1.886 2.920
1.638 2.353
1.533 2.132
1.476 2.015
31.82
6.965
4.541
3.747
3.365
127.3
14.09
7.453
5.598
4.773
4.317
1.000
63.66
636.6
4.303
3.182
9.925
5.841
4.604
4.032
3.707
31.60
12.92
2
0.816
1.061
22.33
3
0.978
0.765
0.741 0.941
0.727 0.920 1.156
10.21
1.190
8.610
6.869
4
2.776
2.571
2.999
7.173
5.893
2.757
2.612
2.517
6.
3.143
5.208
5.959
0.718 0.906 1.134 1.440 1.943
1.415 1.895
1.397 1.860
2.447
2.365
4.785
4.501
5.408
5.041
0.711 0.896 1.119
2.998
3.499
3.355
4.029
8
0.706 0.889
1.108
2.306
2.449
2.896
3.833
0.703
0.883
1.100
1.383
1.833
2.262
2.398
2.821
3.250
3.690
4.297
4.144
4.025
3.930
4.781
4.587
4.437
4.318
4.221
4.140
4.073
4.015
3.965
1.812
1.796
1.782
1.372
2.228
2.201
2.179
2.160
2.145
2.359
2.328
2.303
2.282
2.264
2.249
2.764
3.581
3.497
3.428
3.372
3.326
3.286
10
0.700 0.879 1.093
0.697
0.695
3.169
1.363
0.873 1.083 1.356
0.694 0.870 1.079 1.350 1.771
1.076 1.345
1.074 1.341 1.753
3.106
3.055
3.012
11
0.876 1.088
2.718
2.681
2.650
2.624
12
3.852
3.787
3.733
13
0.868
0.866
2.977
2.947
1.761
14
15
0.692
0.691
2.131
2.602
16
0.690
0.865 1.071
1.337 1.746
2.120
2.235
2.583
2.921
3.252
3.686
0.689
0.688
17
0.863
1.069 1.333
2.224
2.567
3.222
1.740
1.330 1.734
2.110
2.898
3.646
3.611
18
0.862
1.067
2.101
2.214
2.552
2.878
3.197
3.922
3.579
3.552
0.861
1.066
2.093
2.205
2.539
3.883
3.850
19
0.688
1.328 1.729
2.861
3.174
3.153
3.135
1.325 1.725
2.528
2.518
2.508
2.500
2.492
20
0.860
1.064
2.086
2.845
0.687
0.686
0.686
0.685
0.685
0.684
0.684
2.197
3.527
3.505
0.859
1.063
1.061
21
1.323
1.721
2.080
2.189
2.831
3.819
2.819
2.807
2.797
2.787
2.779
0.858
0.858
2.074
2.069
2.064
2.060
2.183
2.177
2.172
2.167
22
1.321
1.717
1.319 1.714
1.318
3.119
1.060
0.857 1.059
1.058
3.485
3.467
3.450
3.792
3.768
3.745
3.725
23
3.104
3.091
24
25
1.711
0.856
1.316
1.708
2.485
3.078
0.856
1.058
1.315 1.706
2.056
3.435
3.421
3.408
26
2.162
2.479
3.067
3.707
0.684 0.855 1.057 1.314 1.703
0.683 0.855 1.056
3.057
3.047
27
2.052
2.158
2.473
2.771
3.690
2.048
2.154
2.467
2.462
2.457
2.423
2.403
2.390
2.374
2.364
2.330
28
1.313
1.701
2.763
3.674
0.854 1.055
0.683 0.854 1.055 1.310
0.851
29
0.683
1.311
1.699
2.045
2.150
2.756
3.038
3.396
3.659
1.697
1.684
1.676
1.296 1.671
1.664
1.660
1.646
1.645
2.042
2.021
2.147
2.123
2.750
2.704
2.678
2.660
2.639
2.626
2.581
2.576
30
3.030
2.971
3.385
3.307
3.261
3.232
3.195
3.174
3.098
3.091
3.646
3.551
3.496
3.460
3.416
1.050 1.303
40
50
60
80
0.681
0.679
0.679
0.678
0.677
0.675
0.849 1.047 1.299
0.848 1.045
0.846 1.043 1.292
0.845 1.042 1.290
1.037
1.036
2.937
2.915
2.887
2.871
2.813
2.807
2.009
2.109
2.000
2.099
1.990
2.088
100
1000
z*
1.984
1.962
1.960
2.081
3.390
0.842
1.282
2.056
3.300
0.674
0.841
1.282
2.054
2.326
3.291
One-sided P
.25
.20
.15
.10
.05
.025
.02
.01
.005
.0025
.001
.0005
Two-sided P
.50
.40
.30
.20
.10
.05
.04
.02
.01
.005
.002
.001
8우
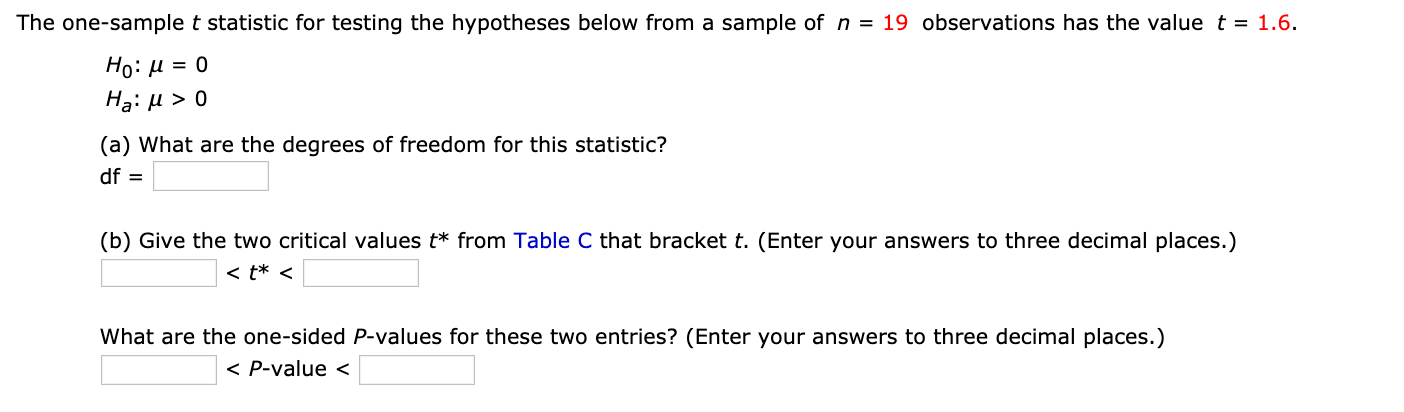
Transcribed Image Text:The one-sample t statistic for testing the hypotheses below from a sample of n = 19 observations has the value t = 1.6.
Но: и 3D о
Hạ: µ > 0
(a) What are the degrees of freedom for this statistic?
df =
(b) Give the two critical values t* from Table C that bracket t. (Enter your answers to three decimal places.)
< t* <
What are the one-sided P-values for these two entries? (Enter your answers to three decimal places.)
< P-value <
Expert Solution
This question has been solved!
Explore an expertly crafted, step-by-step solution for a thorough understanding of key concepts.

This is a popular solution

Trending nowThis is a popular solution!

Step by stepSolved in 4 steps with 2 images

Knowledge Booster

Similar questions
- Test the claim about the population mean, μ, at the given level of significance using the given sample statistics. Claim: μ≠5000; α=0.08; σ=393. Sample statistics: x=5400, n=37 Calculate the standardized test statistic. _____? The standardized test statistic is _____? .(Round to two decimal places as needed.) Determine the critical value(s). Select the correct choice below and fill in the answer box to complete your choice. (Round to two decimal places as needed.) A. The critical value is _____? . B. The critical values are ± _____? Determine the outcome and conclusion of the test. Choose from the following. A.Reject H0. At the 8% significance level, there is enough evidence to reject the claim. B.Fail to reject H0. At the 8% significance level, there is not enough evidence to reject the claim. C.Reject H0. At the 8% significance level, there is enough evidence to support the claim. D. Fail to reject H0. At the 8% significance…arrow_forwardTest the claim that the mean GPA of night students is larger than 3.3 at the 0.005 significance level.The null and alternative hypothesis would be: H0:μ ≤ 3.3H1:μ > 3.3 Based on a sample of 50 people, the sample mean GPA was 3.34 with a standard deviation of 0.05The test statistic is: (to 2 decimals)The p-value is: (to 2 decimals)arrow_forwardIn recent years, approximately 55% of eligible voters take the time to vote in presidential elections. A poll based on a random sample of 200 eligible voters finds that 128 plan to vote in the next presidential election. Does this data provide convincing evidence at the ?α = 0.05 level that the proportion of eligible voters who will take time to vote in the next presidential election differs from 0.55?arrow_forward
- 0pavannnarrow_forwardThe federal government would like to test the hypothesis that the average age of men filing for Social Security is higher than the average age of women set using α = 0.05 with the following data: Men Women Sample mean 64.5 years 63.6 years Sample size 35 39 Population standard deviation 3.0 years 3.5 years If Population 1 is defined as men and Population 2 is defined as women, the p-value for this hypothesis test would be ________.arrow_forwardTest the claim about the population mean, μ, at the given level of significance using the given sample statistics. Claim: μ≠7000; α=0.05; σ=324. Sample statistics: x=7300, n=39 Determine the critical value(s). Select the correct choice below and fill in the answer box to complete your choice. (Round to two decimal places as needed.) A. The critical values are B. The critical value isarrow_forward
arrow_back_ios
SEE MORE QUESTIONS
arrow_forward_ios
Recommended textbooks for you
- MATLAB: An Introduction with ApplicationsStatisticsISBN:9781119256830Author:Amos GilatPublisher:John Wiley & Sons Inc
 Probability and Statistics for Engineering and th...StatisticsISBN:9781305251809Author:Jay L. DevorePublisher:Cengage Learning
 Statistics for The Behavioral Sciences (MindTap C...StatisticsISBN:9781305504912Author:Frederick J Gravetter, Larry B. WallnauPublisher:Cengage Learning
  Elementary Statistics: Picturing the World (7th E...StatisticsISBN:9780134683416Author:Ron Larson, Betsy FarberPublisher:PEARSON
 The Basic Practice of StatisticsStatisticsISBN:9781319042578Author:David S. Moore, William I. Notz, Michael A. FlignerPublisher:W. H. Freeman
 Introduction to the Practice of StatisticsStatisticsISBN:9781319013387Author:David S. Moore, George P. McCabe, Bruce A. CraigPublisher:W. H. Freeman
MATLAB: An Introduction with Applications
Statistics
ISBN:9781119256830
Author:Amos Gilat
Publisher:John Wiley & Sons Inc
Probability and Statistics for Engineering and th...
Statistics
ISBN:9781305251809
Author:Jay L. Devore
Publisher:Cengage Learning
Statistics for The Behavioral Sciences (MindTap C...
Statistics
ISBN:9781305504912
Author:Frederick J Gravetter, Larry B. Wallnau
Publisher:Cengage Learning
Elementary Statistics: Picturing the World (7th E...
Statistics
ISBN:9780134683416
Author:Ron Larson, Betsy Farber
Publisher:PEARSON
The Basic Practice of Statistics
Statistics
ISBN:9781319042578
Author:David S. Moore, William I. Notz, Michael A. Fligner
Publisher:W. H. Freeman
Introduction to the Practice of Statistics
Statistics
ISBN:9781319013387
Author:David S. Moore, George P. McCabe, Bruce A. Craig
Publisher:W. H. Freeman