
MATLAB: An Introduction with Applications
6th Edition
ISBN: 9781119256830
Author: Amos Gilat
Publisher: John Wiley & Sons Inc
expand_more
expand_more
format_list_bulleted
Related questions
Question
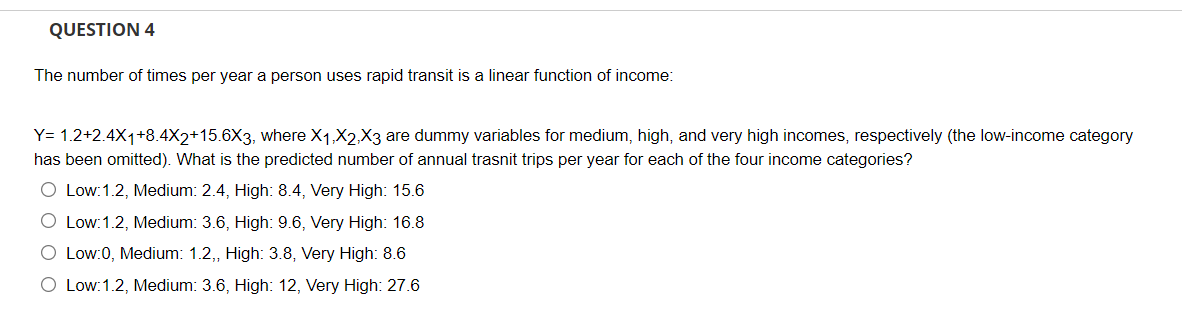

Transcribed Image Text:QUESTION 4
The number of times per year a person uses rapid transit is a linear function of income:
Y= 1.2+2.4X1+8.4X2+15.6X3, where X1,X2,X3 are dummy variables for medium, high, and very high incomes, respectively (the low-income category
has been omitted). What is the predicted number of annual trasnit trips per year for each of the four income categories?
O Low:1.2, Medium: 2.4, High: 8.4, Very High: 15.6
O Low:1.2, Medium: 3.6, High: 9.6, Very High: 16.8
O Low:0, Medium: 1.2,, High: 3.8, Very High: 8.6
O Low:1.2, Medium: 3.6, High: 12, Very High: 27.6
Expert Solution
arrow_forward
Step 1
Let,
Y = The number of times per year a person uses rapid transit.
X1: Medium income
X2: High income
X3: Very High income
Here Y is a response variable and X1, X2, and X3 are the dummy variables.
The linear model is
Y = 1.2 + 2.4 X1 + 8.4 X2 + 15.6 X3

Trending nowThis is a popular solution!

Step by stepSolved in 2 steps

Knowledge Booster

Similar questions
- A collector of antique clocks sold at auction believes that the price received for the clocks may be modeled as a linear function of the age of the clocks and the number of bidders at the auction. After a preliminary study and collection of 32 observations, the collector came up with the following second-order model: y = BO+B₁x₁+B₂x₂ + ß3 x1x2 +B4x² +ɛ, where y: price of a clock; x₁: age of a clock; x2: the number of bidders. Considering the output below and by setting a = 0.05, answer the following questions. The regression equation is Price = 262 +2.26 Age + 14.2 Bidder + 1.13 AgeBid 4.20 Bid^2 Predictor Constant -261.7 2.260 14.21 Age Bidder AgeBid Bid^2 S = 84.512 Coef SE Coef 1.1301 -4.196 Analysis of Variance Source 404.4 2.052 R-Sq= 96.0% Variable Age Bidder AgeBid Bid^2 60.83 0.23 5.17 0.000 0.219 1.344 -3.12 0.004 R-Sq (adj) DF Regression 4 4606950 Residual Error 27 192840 Total 31 4799790 SS T P -0.65 0.523 1.10 0.280 0.817 a. Is the model useful as a whole? Apply an…arrow_forwardSuppose that the number of tee shirts sold (N) depends linearly on the price charged (x). Write an equation showing this dependence.arrow_forward
Recommended textbooks for you
- MATLAB: An Introduction with ApplicationsStatisticsISBN:9781119256830Author:Amos GilatPublisher:John Wiley & Sons Inc
 Probability and Statistics for Engineering and th...StatisticsISBN:9781305251809Author:Jay L. DevorePublisher:Cengage Learning
 Statistics for The Behavioral Sciences (MindTap C...StatisticsISBN:9781305504912Author:Frederick J Gravetter, Larry B. WallnauPublisher:Cengage Learning
  Elementary Statistics: Picturing the World (7th E...StatisticsISBN:9780134683416Author:Ron Larson, Betsy FarberPublisher:PEARSON
 The Basic Practice of StatisticsStatisticsISBN:9781319042578Author:David S. Moore, William I. Notz, Michael A. FlignerPublisher:W. H. Freeman
 Introduction to the Practice of StatisticsStatisticsISBN:9781319013387Author:David S. Moore, George P. McCabe, Bruce A. CraigPublisher:W. H. Freeman
MATLAB: An Introduction with Applications
Statistics
ISBN:9781119256830
Author:Amos Gilat
Publisher:John Wiley & Sons Inc
Probability and Statistics for Engineering and th...
Statistics
ISBN:9781305251809
Author:Jay L. Devore
Publisher:Cengage Learning
Statistics for The Behavioral Sciences (MindTap C...
Statistics
ISBN:9781305504912
Author:Frederick J Gravetter, Larry B. Wallnau
Publisher:Cengage Learning
Elementary Statistics: Picturing the World (7th E...
Statistics
ISBN:9780134683416
Author:Ron Larson, Betsy Farber
Publisher:PEARSON
The Basic Practice of Statistics
Statistics
ISBN:9781319042578
Author:David S. Moore, William I. Notz, Michael A. Fligner
Publisher:W. H. Freeman
Introduction to the Practice of Statistics
Statistics
ISBN:9781319013387
Author:David S. Moore, George P. McCabe, Bruce A. Craig
Publisher:W. H. Freeman