
MATLAB: An Introduction with Applications
6th Edition
ISBN: 9781119256830
Author: Amos Gilat
Publisher: John Wiley & Sons Inc
expand_more
expand_more
format_list_bulleted
Related questions
Concept explainers
Question
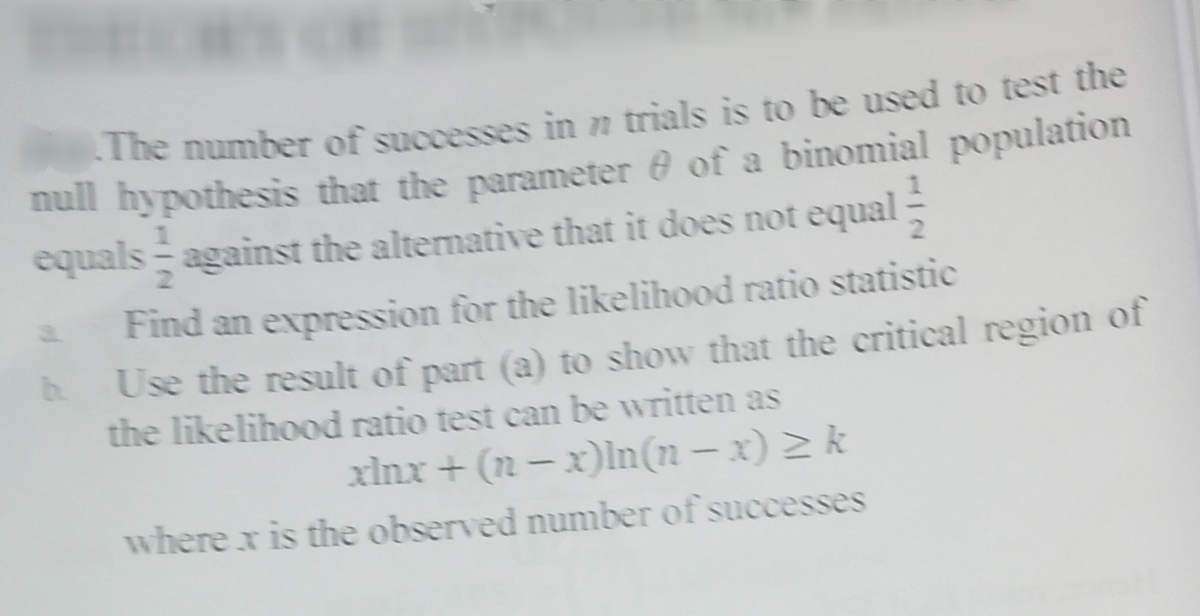

Transcribed Image Text:The number of successes in n trials is to be used to test the
null hypothesis that the parameter of a binomial population
equals against the altemative that it does not equal:
Find an expression for the likelihood ratio statistic
Use the result of part (a) to show that the critical region of
the likelihood ratio test can be written as
b.
xlnx + (n – x)ln(n – x) 2 k
where x is the observed number of successes
Expert Solution
This question has been solved!
Explore an expertly crafted, step-by-step solution for a thorough understanding of key concepts.

This is a popular solution

Trending nowThis is a popular solution!

Step by stepSolved in 4 steps with 5 images

Knowledge Booster


Learn more about
Need a deep-dive on the concept behind this application? Look no further. Learn more about this topic, statistics and related others by exploring similar questions and additional content below.Similar questions
- A random sample of n1 = 157 people ages 16 to 19 were taken from the island of Oahu, Hawaii, and 12 were found to be high school dropouts. Another random sample of n2 = 129 people ages 16 to 19 were taken from Sweetwater County, Wyoming, and 6 were found to be high school dropouts. Do these data indicate that the population proportion of high school dropouts on Oahu is different (either way) from that of Sweetwater County? Use a 1% level of significance. (a) What is the level of significance? What is the value of the sample test statistic? (Test the difference p1 − p2. Do not use rounded values. Round your final answer to two decimal places.) (c) Find (or estimate) the P-value. (Round your answer to four decimal places.)arrow_forwardA researcher is interested in the effect of the pandemic on social media use among college students. The researcher hypothesizes that college students spend more time on social media thanthey did before the pandemic. To test his hypothesis, he randomly selected 50 college students and asked how many hours do they spend on social media per day before and after the pandemic. a) What is the research question? b) What is/are the variable(s)? What graphs can be used to display the variable(s) visually? c) What statistical test can be used to answer the research question?arrow_forwardIn a recent study, 20 males used a new weight-loss supplement, and 14 of them experienced weight loss after two weeks. In the same study, 50 females used the same supplement, and 29 of them experienced weight loss after two weeks. Fill in the blanks below to make the most reasonable statement possible. The new weight-loss supplement was less effective on ▼(Choose one) in the study. That is because % of them failed to lose weight after two weeks, whereas only % of the ▼(Choose one) failed to lose weight after two weeks.arrow_forward
- A fitness course claims that it can improve an individual's physical ability. To test the effect of a physical fitness course on one's physical ability, the number of sit-ups that a person could do in one minute, both before and after the course, was recorded. Ten individuals are randomly selected to participate in the course. The results are displayed in the following table. Can it be concluded, from the data, that participation in the physical fitness course resulted in significant improvement? Let d=(number of sit-ups that can be done after taking the course)−(number of sit-ups that can be done prior to taking the course)d=(number of sit-ups that can be done after taking the course)−(number of sit-ups that can be done prior to taking the course). Use a significance level of α=0.05 for the test. Assume that the numbers of sit-ups are normally distributed for the population both before and after taking the fitness course. Sit-ups before 42 42 23 32 30 42 25 47 35 38 Sit-ups after…arrow_forwardA fitness course claims that it can improve an individual's physical ability. To test the effect of a physical fitness course on one's physical ability, the number of sit-ups that a person could do in one minute, both before and after the course, was recorded. Ten individuals are randomly selected to participate in the course. The results are displayed in the following table. Can it be concluded, from the data, that participation in the physical fitness course resulted in significant improvement? Let d=(number of sit-ups that can be done after taking the course)−(number of sit-ups that can be done prior to taking the course)d=(number of sit-ups that can be done after taking the course)−(number of sit-ups that can be done prior to taking the course). Use a significance level of α=0.05 for the test. Assume that the numbers of sit-ups are normally distributed for the population both before and after taking the fitness course. Sit-ups before 42 42 23 32 30 42 25 47 35 38 Sit-ups after…arrow_forwardA certain medical school accepts only 8% of applicants. A prep program claims that their students are admitted to this medical school at a higher rate. To test their claim at the 10% significance level, we select at random 144 students from the prep program (who all apply to this medical school), and we compute p, the proportion of the sample who are admitted to the medical school.arrow_forward
- Xu and Garcia (2008)conducted a research study demonstrating that 8-month-old infants appear to recognize which samples are likely to be obtained from a population and which are not. In the study, the infants watched as a sample of n = 5 ping-pong balls was selected from a large box. In one condition, the sample consisted of 1 red ball and 4 white balls. After the sample was selected, the front panel of the box was removed to reveal the contents. In the expected condition, the box contained primarily white balls like the sample, and the infants looked at it for an average of M = 7.5 seconds. In the unexpected condition, the box had primarily red balls, unlike the sample, and the infants looked at it for M = 9.9. The researchers interpreted the results as demonstrating that the infants found the unexpected result surprising and, therefore, more interesting than the expected result. Assuming that the standard error for both means is σM = 1 second, draw a bar graph showing the two sample…arrow_forwardAgain, you play the game where Bianca rolls a die and wins if it shows a 1 or a 2, otherwise you win. Out of 7 games, how many times does she have to win at least so that you would reject the null hypothesis (that the die is fair, results random) at the 5%-significance level? You can look up numbers in the Binomial table, but remember that one number is not enough. You can also use the Online Calculator, but then you need to convert the answer to percent.arrow_forwardResearch has shown that losing even one night’s sleep can have a significant effect on performance ofcomplex tasks such as problem solving (Linde &Bergstroem, 1992). To demonstrate this phenomenon,a sample of n=25 college students was given aproblem-solving task at noon on one day and again atnoon on the following day. The students were notpermitted any sleep between the two tests. For eachstudent, the difference between the first and secondscore was recorded. For this sample, the studentsaveraged MD=4.7 points better on the first test with avariance of s2=64 for the difference scores. a.Do the data indicate a significant change in problem-solving ability? Use a two-tailed test with a= .05. b.Compute an estimated Cohen’s dto measure thesize of the effectarrow_forward
arrow_back_ios
arrow_forward_ios
Recommended textbooks for you
- MATLAB: An Introduction with ApplicationsStatisticsISBN:9781119256830Author:Amos GilatPublisher:John Wiley & Sons Inc
 Probability and Statistics for Engineering and th...StatisticsISBN:9781305251809Author:Jay L. DevorePublisher:Cengage Learning
 Statistics for The Behavioral Sciences (MindTap C...StatisticsISBN:9781305504912Author:Frederick J Gravetter, Larry B. WallnauPublisher:Cengage Learning
  Elementary Statistics: Picturing the World (7th E...StatisticsISBN:9780134683416Author:Ron Larson, Betsy FarberPublisher:PEARSON
 The Basic Practice of StatisticsStatisticsISBN:9781319042578Author:David S. Moore, William I. Notz, Michael A. FlignerPublisher:W. H. Freeman
 Introduction to the Practice of StatisticsStatisticsISBN:9781319013387Author:David S. Moore, George P. McCabe, Bruce A. CraigPublisher:W. H. Freeman
MATLAB: An Introduction with Applications
Statistics
ISBN:9781119256830
Author:Amos Gilat
Publisher:John Wiley & Sons Inc
Probability and Statistics for Engineering and th...
Statistics
ISBN:9781305251809
Author:Jay L. Devore
Publisher:Cengage Learning
Statistics for The Behavioral Sciences (MindTap C...
Statistics
ISBN:9781305504912
Author:Frederick J Gravetter, Larry B. Wallnau
Publisher:Cengage Learning
Elementary Statistics: Picturing the World (7th E...
Statistics
ISBN:9780134683416
Author:Ron Larson, Betsy Farber
Publisher:PEARSON
The Basic Practice of Statistics
Statistics
ISBN:9781319042578
Author:David S. Moore, William I. Notz, Michael A. Fligner
Publisher:W. H. Freeman
Introduction to the Practice of Statistics
Statistics
ISBN:9781319013387
Author:David S. Moore, George P. McCabe, Bruce A. Craig
Publisher:W. H. Freeman