MATLAB: An Introduction with Applications
6th Edition
ISBN: 9781119256830
Author: Amos Gilat
Publisher: John Wiley & Sons Inc
expand_more
expand_more
format_list_bulleted
Question

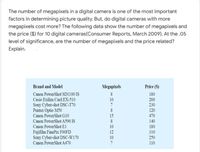
Transcribed Image Text:The number of megapixels in a digital camera is one of the most important
factors in determining picture quality. But, do digital cameras with more
megapixels cost more? The following data show the number of megapixels and
the price ($) for 10 digital cameras(Consumer Reports, March 2009). At the .05
level of significance, are the number of megapixels and the price related?
Explain.
Brand and Model
Megapixels
Price (S)
Canon PowerShot SDI100 IS
180
Casio Exilim Card EX-510
200
230
120
10
Sony Cyber-shot DSC-T70
Pentax Optio MS0
Canon PowerShot G10
Canon PowerShot A590 IS
7
15
470
140
180
310
Canon PowerShot El
10
Fujifilm FinePix FOOFD
Sony Cyber-shot DSC-W170
Canon PowerShot A470
12
10
250
110
7
Expert Solution
This question has been solved!
Explore an expertly crafted, step-by-step solution for a thorough understanding of key concepts.
This is a popular solution
Trending nowThis is a popular solution!
Step by stepSolved in 2 steps

Knowledge Booster
Similar questions
- The comparison line graph indicates the rainfall for the last six months of two different 2013 years in Nowhereville. How many more inches of rain fell in October 2013 than in September 2013? 2014 04 July Aug Sept Oct Nov Dec Month ..... inch(es) (Simplify your answer.) Rainfall (in inches)arrow_forwardDetermine which of the levels of measurement (nominal, ordinal, ratio) is most appropriate. The subjects in which college students major.arrow_forwardDescribe the differences between a nominal and an ordinal scale.arrow_forward
- A group of 500 students take a survey about distance learning. 150 prefer distance learning. What is the proportion of students that prefer distance learning.arrow_forwardWhat is the difference between relative frequency and cumulative frequency? Choose the correct answer below. A. Relative frequency of a class is the number of observations in that class, while cumulative frequency of a class is the sum of all the frequencies. B. Relative frequency of a class is the proportion of the data in that class, while cumulative frequency of a class is the number of observations in that class. C. Relative frequency of a class is the percentage of the data that falls in that class, while cumulative frequency of a class is the sum of the frequencies of that class and all previous classes. O D. There is no difference between the two.arrow_forwardwhat level of measurement is the rating of the overall quality of a textbook from excellent to poorarrow_forward
- Assemble fuel consumption data for 10 automobiles of your choice (in litres/100km). Show details of how you arrive at the 5-number-summary and carefully draw the Boxplot.arrow_forwardDescribe about the Qualitative Data and Nominal Measurement.arrow_forwardWhich are the graphs for quantitative data?arrow_forward
arrow_back_ios
SEE MORE QUESTIONS
arrow_forward_ios
Recommended textbooks for you
 MATLAB: An Introduction with ApplicationsStatisticsISBN:9781119256830Author:Amos GilatPublisher:John Wiley & Sons Inc
 Probability and Statistics for Engineering and th...StatisticsISBN:9781305251809Author:Jay L. DevorePublisher:Cengage Learning
 Statistics for The Behavioral Sciences (MindTap C...StatisticsISBN:9781305504912Author:Frederick J Gravetter, Larry B. WallnauPublisher:Cengage Learning
 Elementary Statistics: Picturing the World (7th E...StatisticsISBN:9780134683416Author:Ron Larson, Betsy FarberPublisher:PEARSON
 The Basic Practice of StatisticsStatisticsISBN:9781319042578Author:David S. Moore, William I. Notz, Michael A. FlignerPublisher:W. H. Freeman
 Introduction to the Practice of StatisticsStatisticsISBN:9781319013387Author:David S. Moore, George P. McCabe, Bruce A. CraigPublisher:W. H. Freeman

MATLAB: An Introduction with Applications
Statistics
ISBN:9781119256830
Author:Amos Gilat
Publisher:John Wiley & Sons Inc

Probability and Statistics for Engineering and th...
Statistics
ISBN:9781305251809
Author:Jay L. Devore
Publisher:Cengage Learning

Statistics for The Behavioral Sciences (MindTap C...
Statistics
ISBN:9781305504912
Author:Frederick J Gravetter, Larry B. Wallnau
Publisher:Cengage Learning

Elementary Statistics: Picturing the World (7th E...
Statistics
ISBN:9780134683416
Author:Ron Larson, Betsy Farber
Publisher:PEARSON

The Basic Practice of Statistics
Statistics
ISBN:9781319042578
Author:David S. Moore, William I. Notz, Michael A. Fligner
Publisher:W. H. Freeman

Introduction to the Practice of Statistics
Statistics
ISBN:9781319013387
Author:David S. Moore, George P. McCabe, Bruce A. Craig
Publisher:W. H. Freeman