MATLAB: An Introduction with Applications
6th Edition
ISBN: 9781119256830
Author: Amos Gilat
Publisher: John Wiley & Sons Inc
expand_more
expand_more
format_list_bulleted
Question
thumb_up100%

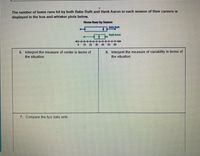
Transcribed Image Text:The number of home runs hit by both Babe Ruth and Hank Aaron in each season of their careers is
displayed in the box-and-whisker plots below.
Home Runs by Season
Babe Ruth
Hank Aaron
10
20
30
40
50
60
5. Interpret the measure of center in terms of
6. Interpret the measure of variability in terms of
the situation.
the situation.
7. Compare the two data sets.
Expert Solution
This question has been solved!
Explore an expertly crafted, step-by-step solution for a thorough understanding of key concepts.
This is a popular solution
Trending nowThis is a popular solution!
Step by stepSolved in 2 steps

Knowledge Booster
Similar questions
- The data represents the heights of eruptions by a geyser. Use the heights to construct a stemplot. Identify the two values that are closest to the middle when the data are sorted in order from lowest to highest. Height of eruption (in.) 69 33 50 900 80 50 40 70 50 68 79 54 Which plot represents a stemplot of the data? OA. 3 002 4049 5008 6005 7006 8009 906 B. 33 400 500024 605689 70009 806 90 Identify the two values that are closest to the middle when the data are sorted in order from lowest to highest. The values closest to the middle are inches and (Type whole numbers. Use ascending order.) inches. O C. 33 4045689 50009 6006 70002 80 90 52 66 65 60 70 70 40 86arrow_forwardplease answer A and B thank you.arrow_forwardUse a stem-and-leaf plot to display the data, which represent the numbers of hours 24 nurses work per week. Describe any patterns. 40 40 44 48 35 40 36 58 32 36 40 35 D 30 28 36 40 36 40 33 40 32 38 29 Determine the leaves in the stem-and-leaf plot below. Key: 3|3 = 33 Hours worked 2 4 What best describes the data? O A. Most nurses work under 40 hours per week. O B. Most nurses work over 40 hours per week. O C. Most nurses work between 40 and 50 hours per week, inclusive. O D. Most nurses work between 30 and 40 hours per week, inclusive. 40 3.arrow_forward
- Solve. 4) Construct a box plot from the data below. 20 25 26 26 26 272933 41 43 45 46 47 4850 50 50 51 53 55 57 60 61 62 63arrow_forwardThe data represents the heights of eruptions by a geyser. Use the heights to construct a stemplot. Identify the two values that are closest to the middle when the data are sorted in order from lowest to highest. Height of eruption (in.) 69 37 50 90- 80 50 40 70 50 64 72 57 59 69 67 60 77 70 48 86 Which plot represents a stemplot of the data? A. 37 408 500079 604799 70027 806 90 B. 3 089 4079 5 004 6 007 7009 8 027 906 Identify the two values that are closest to the middle when the data are sorted in order from lowest to highest. The values closest to the middle are inches and inches. (Type whole numbers. Use ascending order.) ○ C. 37 4047799 50027 6006 70089 80 90arrow_forwardConstruct a scatter plot from the given points and describe the correlation.arrow_forward
- Which is the line-of-best-fit for the data represented below? Height Weight Tim 67 160 Evan 73 210 Peter 66 167 Kevin 75 220 Carson 68 185 Will 70 180 Jamar 72 185 James 65 146 Find the equation y=mx+b without using a calculator nor excel.arrow_forwardThe table shows total earnings, y (in dollars ), of a food x,0,1,2,3,4,5,6 y,0,18,40,62,77,85,113 a. Make a scatter plot. b. What type of correlation is shown in the graarrow_forwardA physics professor wishes to compare quiz grades between her two classes. The quiz was worth 10 points. The dot plots show the grade distributions. 4 10 9. Class A 10 Class B Each dot represents a What was the lowest quiz grade in Class A? What was the highest quiz grade in Class 8?arrow_forward
arrow_back_ios
arrow_forward_ios
Recommended textbooks for you
 MATLAB: An Introduction with ApplicationsStatisticsISBN:9781119256830Author:Amos GilatPublisher:John Wiley & Sons Inc
 Probability and Statistics for Engineering and th...StatisticsISBN:9781305251809Author:Jay L. DevorePublisher:Cengage Learning
 Statistics for The Behavioral Sciences (MindTap C...StatisticsISBN:9781305504912Author:Frederick J Gravetter, Larry B. WallnauPublisher:Cengage Learning
 Elementary Statistics: Picturing the World (7th E...StatisticsISBN:9780134683416Author:Ron Larson, Betsy FarberPublisher:PEARSON
 The Basic Practice of StatisticsStatisticsISBN:9781319042578Author:David S. Moore, William I. Notz, Michael A. FlignerPublisher:W. H. Freeman
 Introduction to the Practice of StatisticsStatisticsISBN:9781319013387Author:David S. Moore, George P. McCabe, Bruce A. CraigPublisher:W. H. Freeman

MATLAB: An Introduction with Applications
Statistics
ISBN:9781119256830
Author:Amos Gilat
Publisher:John Wiley & Sons Inc

Probability and Statistics for Engineering and th...
Statistics
ISBN:9781305251809
Author:Jay L. Devore
Publisher:Cengage Learning

Statistics for The Behavioral Sciences (MindTap C...
Statistics
ISBN:9781305504912
Author:Frederick J Gravetter, Larry B. Wallnau
Publisher:Cengage Learning

Elementary Statistics: Picturing the World (7th E...
Statistics
ISBN:9780134683416
Author:Ron Larson, Betsy Farber
Publisher:PEARSON

The Basic Practice of Statistics
Statistics
ISBN:9781319042578
Author:David S. Moore, William I. Notz, Michael A. Fligner
Publisher:W. H. Freeman

Introduction to the Practice of Statistics
Statistics
ISBN:9781319013387
Author:David S. Moore, George P. McCabe, Bruce A. Craig
Publisher:W. H. Freeman